. 2025 Aug 4;37(8):koaf201.
doi: 10.1093/plcell/koaf201.

The receptor-like cytoplasmic kinase AeRLCK2 mediates Nod-independent rhizobial symbiosis in Aeschynomene legumes

Affiliations

The receptor-like cytoplasmic kinase AeRLCK2 mediates Nod-independent rhizobial symbiosis in Aeschynomene legumes

Natasha Horta Araújo et al. Plant Cell. .

Abstract

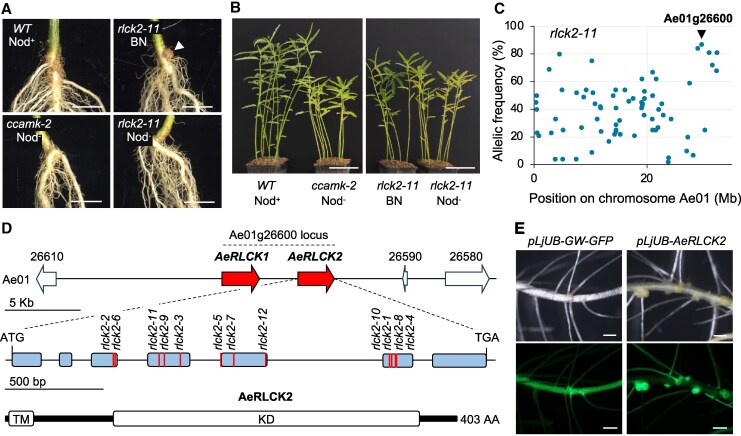
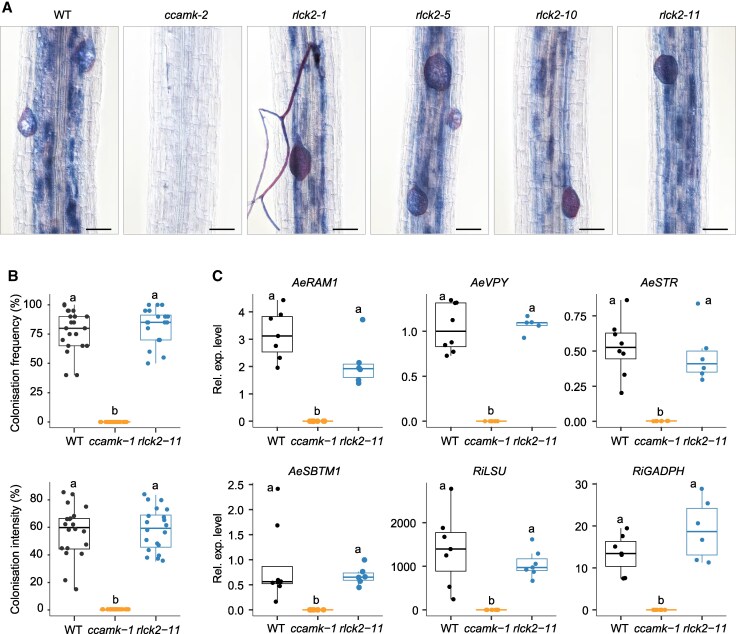
Many plants interact symbiotically with arbuscular mycorrhizal fungi to enhance inorganic phosphorus uptake, and legumes also develop a nodule symbiosis with rhizobia for nitrogen acquisition. The establishment and functioning of both symbioses rely on a common plant signaling pathway activated by structurally related Myc and Nod factors. Recently, a SPARK receptor-like kinase (RLK)/receptor-like cytoplasmic kinase (RLCK) complex was shown to be essential for arbuscular mycorrhiza formation in both monocot and dicot plants. Here, we show that in Aeschynomene legumes, the RLCK component of this receptor complex has undergone a gene duplication event and mediates a unique nodule symbiosis that is independent of rhizobial Nod factors. In Aeschynomene evenia, AeRLCK2 is crucial for nodule initiation but not for arbuscular mycorrhiza symbiosis. Additionally, AeRLCK2 physically interacts with and is phosphorylated by the cysteine-rich RLK, AeCRK, which is also required for nodulation. This finding uncovers an important molecular mechanism that controls the establishment of nodulation and is associated with Nod-independent symbiosis.


Conflict of interest statement

Conflict of interest statement. None declared.

Figures

Figure 1.
Figure 1.
Mutant-based identification of AeRLCK2 as required for Nod-independent symbiosis. A) Root phenotypes of Wilde Type (WT), ccamk-2 and rlck2-11 plants at 28 dpi with Bradyrhizobium ORS278 strain and grown in greenhouse conditions. Nod+: presence of WT nodules, Nod: Absence of nodules, BN: Big Nodule (white arrowhead). Scale bar: 1 cm. B) Aerial phenotypes of the same plants grown for 15 additional days in greenhouse conditions after analysis of their root nodulation. Scale bar: 10 cm. C) Frequency of EMS-induced mutant alleles in pools of Nod backcrossed F2 plants derived from the rlck2-11 mutant using mapping-by-sequencing. The SNP corresponding to the putative causal mutation in rlck2-11 is marked with a black arrowhead. D)  AeRLCK2 gene and protein structure. Upper panel: genomic region of chromosome Ae01 containing the Ae01g26600 locus. Filled arrows indicate RLCK genes. Middle panel: gene structure of AeRLCK2. Blue boxes represent exons and red lines indicate the positions of the EMS mutations in the rlck2 mutants. Bottom panel: domain structure of the predicted AeRLCK2 protein. White boxes indicate the positions of the predicted domains: TM for transmembrane domain and KD for kinase domain. E) Functional complementation of A. evenia rlck2-11. Hairy roots of rlck2-11 transformed with either the empty vector (left images) or containing the AeRLCK2 CDS under the control of pLjUb (right images) at 14 dpi with Bradyrhizobium ORS278. GFP (Green Fluorescent Protein) was used as a plant transformation marker. Scale bar: 500 µm.
Figure 2.
Figure 2.
Bradyrhizobium infection and symbiotic signaling in rlck2 mutants. A) Frequency of nodule occurrence at 21 dpi in Wild Type (WT), ccamk-2, rlck2-1, rlck2-5, rlck2-10 and rlck2-11 plants. Error bars represent SD (n = 3 biological replicates from independent experiments, with at least 15 plants per line in each replicate). B) Comparison of root nodulation phenotypes in WT, ccamk-2 and rlck2-11, under noninoculated (NI) or Bradyrhizobium ORS278-inoculated (I) plants at 21 dpi. Note the presence of either a Nod or an BN phenotype in rlck2-11 inoculated roots. Scale bar: 1 mm. C) ARH diameter in WT, ccamk-2 and rlck2-11 at different time-points in noninoculated (NI) and inoculated (I) plants with Bradyrhizobium ORS278. T0: time 0. T14: time 14 d after inoculation or not. Dots represent individual measurements. D) ARH colonization of WT, ccamk-2 and rlck2-11 plants at 21 dpi with GUS-tagged ORS278, observed on whole roots (upper and middle panels) and root sections (lower panels). Scale bars: 1 mm (upper panels) and 0.5 mm (middle and lower panels). E) Expression of nodulation-induced gene in WT, ccamk-1 and rlck2-11 plants. Relative expression levels (Rel. exp. level) of AeNIN (NODULE INCEPTION), AeSymREM1 (Symbiotic REMORIN 1), AeENOD40 (EARLY NODULIN 40), AeSBT (SUBTILASE), AeVPY (VAPYRIN) and AeCRK (Cystein-rich Receptor-like Kinase) were measured by RT-qPCR in plant roots at 0, 2, 4 and 7 dpi. The results were normalized against AeEF1a and Ubiquitin housekeeping genes. Data presented in boxplots correspond to 4 biological replicates, each derived from independent experiments, with at least 5 plants per line in each replicate. Different letters indicate significant differences between conditions as determined by analysis of variance (Kruskal-Wallis) and post-hoc analysis (Dunn's test), P < 0.05. Box plots showing the median (bold segment), interquartile range (box from Q1 to Q3), minimum and maximum (whiskers), and outliers (individual points).
Figure 3.
Figure 3.
Nodule development and colonization by Bradyrhizobium in rlck2 mutants. A) Number of pink nodules formed on nodulated plants in Wild Type (WT), rlck2-1, 5, 10 and 11 plants at 21 dpi with Bradyrhizobium ORS278. Numbers below the boxplots indicate the number of nodulated plants relative to the total number of inoculated plants. B) Nodule diameter and C) nitrogenase enzyme activity measured by ARA (n ≥ 3 nodulated roots per line and biological replicate) from the same plants as in A. Data in A to C correspond to 3 biological replicates from independent experiments. Dots represent individual plants. Letters indicate significant differences between conditions, as determined by analysis of variance (Kruskal-Wallis) and post-hoc analysis (Dunn's test), P < 0.05. Box plots showing the median (bold segment), interquartile range (box from Q1 to Q3), minimum and maximum (whiskers), and outliers (individual points). D) Cross-sections of WT and rlck2-11 nodules observed under brightfield (top) or FITC filter (bottom). Yellow/green fluorescence was pseudocolored in magenta, and red fluorescence was pseudocolored in yellow for visualization purposes. White arrows indicate the occurrence of defense-like responses within the nodule. Scale bar: 500 μm. E) Cytological analysis of nodule cross-sections from WT and rlck2-11 plants using a confocal microscope after staining with SYTO9 (live bacteria), propidium iodide (infected plant nuclei and dead bacteria or bacteria with a compromised membrane) and calcofluor (plant cell wall). For visualization purposes, SYTO 9 (originally green) was pseudocolored in magenta, propidium iodide (originally red) in yellow, and calcofluor (originally blue) in cyan. White arrows show elongated bacteria. Scale bars: 500 μm (top), 50 μm (bottom).
Figure 4.
Figure 4.
AeRLCK2-AeCRK interaction and kinase assays. A) Confocal microscopy observations of Nicotiana benthamiana leaf cells showing plasma membrane localization of AeCRKG359E-YFP, AeRLCK2-YFP, and nucleo-cytoplasmic distribution of the truncated transmembrane version of RLCK2 (AeRLCK2ΔTM). MtLYK3-CFP (Cyan FP) was used as a plasma membrane marker. Scale bar: 20 µm. B) Co-immunoprecipitation assay showing interaction of AeCRKG359E-mCherry with AeCRKG359E-YFP and AeRLCK2-YFP. Proteins were immunoprecipitated (IP) with αRFP magnetic agarose beads and co-purified proteins were detected with αGFP (Green FP) antibodies (upper panel). Input (middle panel) and band intensities were calculated and normalized to the negative control MtLYK3 (bottom panel, ranging from 2 to 4 biological replicates from independent experiments). Error bars represent SD, dots show biological replicates. Ponceau staining was used as loading control. C) Split-luciferase assay showing the interaction of AeCRKG359E-CLuc with AeCRKG359E-NLuc or AeRLCK2-NLuc (N/C-terminal part of the Luciferase). Boxplots represent bioluminescence intensity from 7 biological independent replicates. Dots show individual measurements. Expression levels of 3Flag-CLuc and 3HA-NLuc fusions were assessed by western blot (Supplementary Fig. S6). Bioluminescence intensities were normalized to protein expression and data were Log-transformed (Log10). Letters indicate significant differences between samples, as determined by analysis of variance (Kruskal-Wallins) and post-hoc analysis (Dunn's test), P < 0.05. Box plots showing the median (bold segment), interquartile range (box from Q1 to Q3), minimum and maximum (whiskers), and outliers (individual points). RLU, Relative luminescence unit. D) Kinase activity assay showing transphosphorylation of AeRLCK2 by AeCRK in Nicotiana benthamiana leaf cells. Full-length YFP-tagged proteins were immunoprecipitated with αGFP magnetic agarose beads. Phosphorylation status was analyzed after SDS-PAGE and detected with anti-S, -T and -Y antibodies. Asterisks indicate the phosphorylation status of AeRLCK2-YFP (top). Input (bottom).
Figure 5.
Figure 5.
Phylogeny of legume RLCK genes and evolution in Aeschynomene species. A) Maximum likelihood (ML) phylogenetic reconstruction of the orthogroup containing AeRLCK2. Color coding indicates nonpapilionoid RLCKs (green), the 2 papilionoid RLCK clades (purple and yellow) putatively originating from the 58-MA WGD event (green dot), and the 2 RLCK copies present in A. evenia (red), which are derived from a recent tandem duplication (red dot). B) Detection of different RLCK gene versions in Aeschynomene species and the closely related species Soemmeringia semperflorens. The ML phylogenetic tree was constructed using concatenated ITS and matK sequences. Green stars indicate a Nod-dependent symbiosis and red stars indicate a Nod-independent symbiosis. The RLCK_O, RLCK1 and/or RLCK2 copies were identified in available RNAseq data (orange square) and by PCR amplification on genomic DNA (blue square). A and B support values were determined using 100,000 iterations of the ultrafast bootstraps approximation (UFboot). Tree scale: mutations per site. C) Domain structure of AaRLCK_O, AeRLCK1 and AeRLCK2 and sequence similarities between the proteins. White bars indicate predicted domains. TM, transmembrane domain; KD, kinase domain; AA, amino acids. Intensities of blue shaded backgrounds delineate zones with different level of sequence identity. All domains are to scale.
Figure 6.
Figure 6.
Arbuscular mycorrhizal (AM) root colonization in rlck2 mutants. A) Microscopy images of R. irregularis colonization of Wild Type (WT), ccamk-2 and rlck2 mutants at 6 wk post-inoculation (wpi), stained with Sheaffer skrip ink. Scale bars: 50 µm. B) Box plots show the colonization frequency and intensity, both expressed as percentages, in 6 wpi WT, ccamk-2 and rlck2-11 plants. C) Analysis of AM-induced gene expression in WT, ccamk-2 and rlck2-11 plants. Relative expression levels (Rel. exp. level) of plant AeRAM1 (Reduced Arbuscular Mycorrhization 1), AeVPY (VAPYRIN), AeSTR (STUNTED ARBUSCULE), AeSBTM1 (subtilase gene induced during mycorrhization) and fungal RiLSU (large ribosomal subunit), RiGADPH (glyceraldehyde 3-phosphate dehydrogenase) genes were measured by RT-qPCR in roots of 6 wpi plants. The results were normalized against AeEF1a and Ubiquitin. Data presented in boxplots correspond to 4 biological replicates from independent experiments, with 5 plants per line in each replicate. Box plots show the median (bold segment), interquartile range (box from Q1 to Q3), minimum and maximum (whiskers), and outliers (individual points). Dots show individual measurements. Letters indicate significant differences between lines, as determined by analysis of variance (Kruskal-Wallis) and post-hoc analysis (Dunn's test), P < 0.05.
Figure 7.
Figure 7.
A. evenia rlck2 mutant cross-complementation of root nodulation. Hairy roots of A. evenia rlck2-11 plants were transformed with the empty vector (EV) containing the DsRed marker, or the same vector containing pAeRLCK2:RLCK0, pAeRLCK2:RLCK1 or pAeRLCK2:RLCK2 and their nodulation phenotype was evaluated 21 dpi with Bradyrhizobium ORS278. Observations were made on 2 biological replicates from independent experiments. Representative root nodulation phenotypes are shown here and detailed in Supplementary Table S8. A) Plant aerial phenotype. B) Number of pink and white nodules formed on plants expressing the indicated constructs. Dots represent individual plants. Red numbers below the boxplots indicate the number of plants with pink nodules, relative to the total number of transformed plants. Letters indicate significant differences between constructs, as determined by analysis of variance (Kruskal-Wallis) and post-hoc analysis (Dunn's test), P < 0.05. Box plots showing the median (bold segment), interquartile range (box from Q1 to Q3), minimum and maximum (whiskers), and outliers (individual points). C) Nodule analysis on rlck2-11 roots transformed with the indicated constructs. Top and middle panels: microscopy observations of whole nodules under brightfield and red fluorescence using a DsRed filter, respectively. Bottom panels: cross-sections of nodules stained with SYTO 9, propidium iodide and calcofluor, and observed with a confocal microscope. For visualization purposes, SYTO 9 (originally green) was pseudocolored in magenta, propidium iodide (originally red) in yellow, and calcofluor (originally blue) in cyan. Scale bars: 1 mm (top and middle panels), 0.5 mm (bottom panel).
Figure 8.
Figure 8.
Expression pattern of AeRLCK2 and comparison with other Aeschynomene RLCK and CRK genes. A) RNAseq-based gene expression levels of AeRLCK1, AeRLCK2, AeCRK, AaRLCK_O, AaRLCK_P and AaCRK in roots of A. evenia and A. afraspera, noninoculated (NI) and inoculated (I) with compatible Bradyrhizobium strains. Data correspond to 3 biological replicates from independent experiments. Error bars indicate standard deviation (SD). B and C) Histochemical localization of GUS activity in hairy roots of WT A. evenia transformed with B  pRLCK2:GUS and C  pCRK:GUS during nodulation with Bradyrhizobium ORS278. NI: noninoculated, dpi: days post-inoculation. Top panels: whole roots observed under a light stereomicroscope. Bottom panels: sections of roots and nodules observed by microscope. Scale bars: 1 mm (upper panels), 0.1 mm (bottom panels).
Figure 9.
Figure 9.
Model of RLCK functions in arbuscular mycorrhiza (AM) and Nod-independent symbiosis in legumes. During AM in L. japonicus, the paralogs AMK8 and AMK24 (ARBUSCULAR MYCORRHIZA-INDUCED KINASES) interact with KIN3 (KINASE 3) at the periarbuscular membrane. Autophosphorylation and transphosphorylation events in this RLCK-RLK complex are linked to mediate downstream AM responses. In contrast to LjKIN3, LjAMK8 and LjAMK24 are also expressed during nodulation; however, their putative role in the rhizobial symbiosis remains unknown. In A. evenia, the LjAMK24 counterpart is absent, while 2 proteins, AeRLCK1 and AeRLCK2, are closely related to LjAMK8. AeRLCK2 is expressed during AM but does not appear to be essential for this process. While the symbiotic role of AeRLCK1 is currently unknown, AeRLCK2 is central in mediating Nod-independent symbiosis with photosynthetic bradyrhizobia. One of its functions is to interact with and be phosphorylated by AeCRK at the plasma membrane, which is important for RLCK2 function in nodule initiation. The upstream signal and downstream signaling components remain to be elucidated.

Similar articles

References

    1. Arrighi JF, Cartieaux F, Brown SC, Rodier-Goud M, Boursot M, Fardoux J, Patrel D, Gully D, Fabre S, Chaintreuil C, et al. Aeschynomene evenia, a model plant for studying the molecular genetics of the Nod-independent rhizobium-legume symbiosis. Mol Plant Microbe Interact. 2012:25(7):851–861. 10.1094/MPMI-02-12-0045-TA - DOI - PubMed
    1. Bonaldi K, Gargani D, Prin Y, Fardoux J, Gully D, Nouwen N, Goormachtig S, Giraud E. Nodulation of Aeschynomene afraspera and A. indica by photosynthetic Bradyrhizobium sp. strain ORS285: the nod-dependent versus the nod-independent symbiotic interaction. Mol Plant Microbe Interact. 2011:24(11):1359–1371. 10.1094/MPMI-04-11-0093 - DOI - PubMed
    1. Bravo A, York T, Pumplin N, Mueller LA, Harrison MJ. Genes conserved for arbuscular mycorrhizal symbiosis identified through phylogenomics. Nat Plants. 2016:2(2):15208. 10.1038/nplants.2015.208 - DOI - PubMed
    1. Brottier L, Chaintreuil C, Simion P, Scornavacca C, Rivallan R, Mournet P, Moulin L, Lewis GP, Fardoux J, Brown SC, et al. A phylogenetic framework of the legume genus Aeschynomene for comparative genetic analysis of the nod-dependent and nod-independent symbioses. BMC Plant Biol. 2018:18(1):333. 10.1186/s12870-018-1567-z - DOI - PMC - PubMed
    1. Buendia L, Girardin A, Wang T, Cottret L, Lefebvre B. Lysm receptor-like kinase and LysM receptor-like protein families: an update on phylogeny and functional characterization. Front Plant Sci. 2018:9:1531. 10.3389/fpls.2018.01531 - DOI - PMC - PubMed

LinkOut - more resources