. 2025 Aug 14;23(8):e3003322.
doi: 10.1371/journal.pbio.3003322. eCollection 2025 Aug.

Multispecies characterization of immature neurons in the mammalian amygdala reveals their expansion in primates

Affiliations

Multispecies characterization of immature neurons in the mammalian amygdala reveals their expansion in primates

Marco Ghibaudi et al. PLoS Biol. .

Abstract

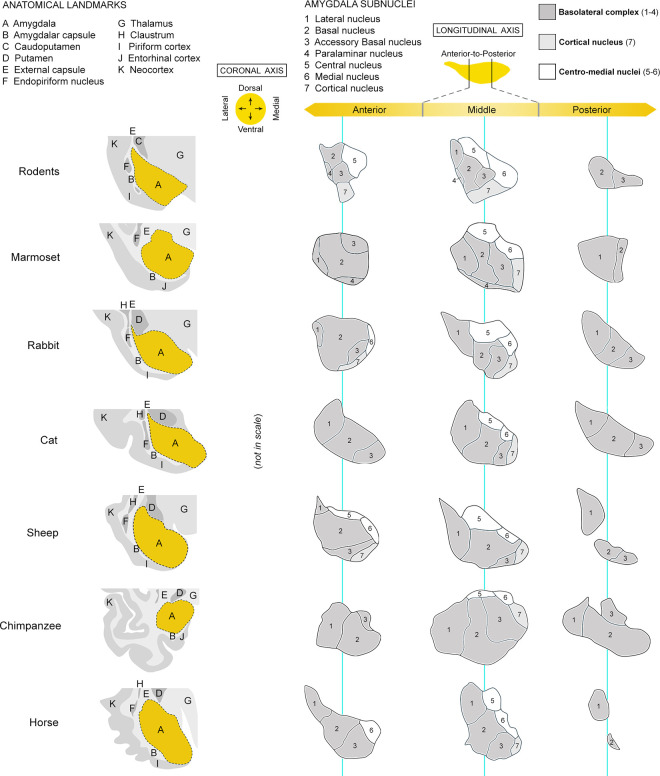
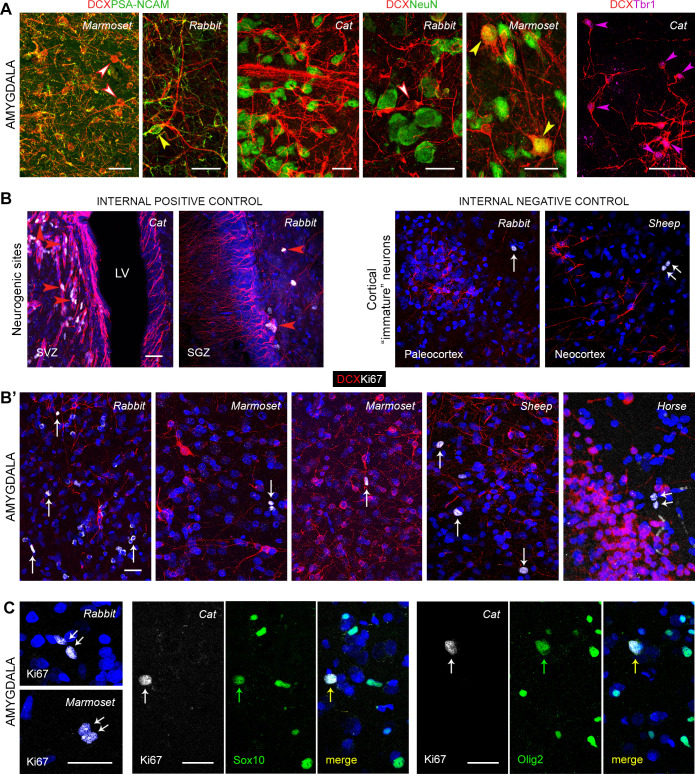
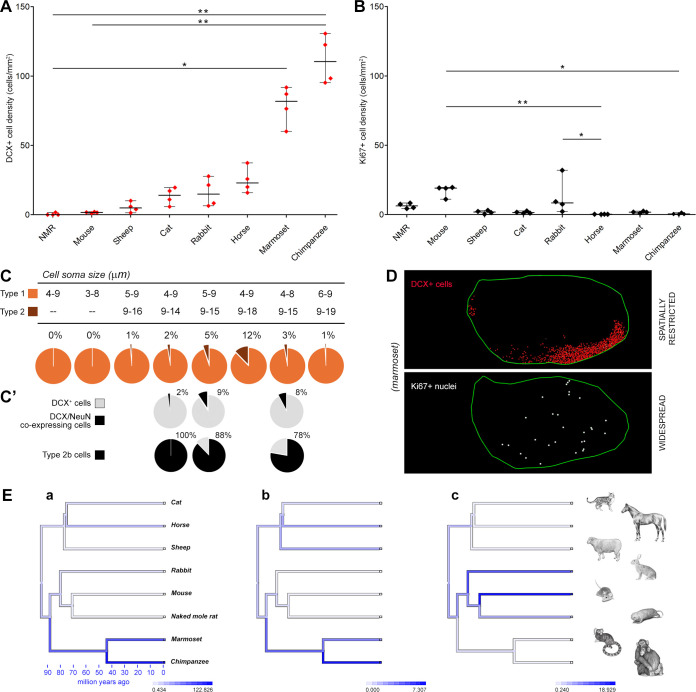
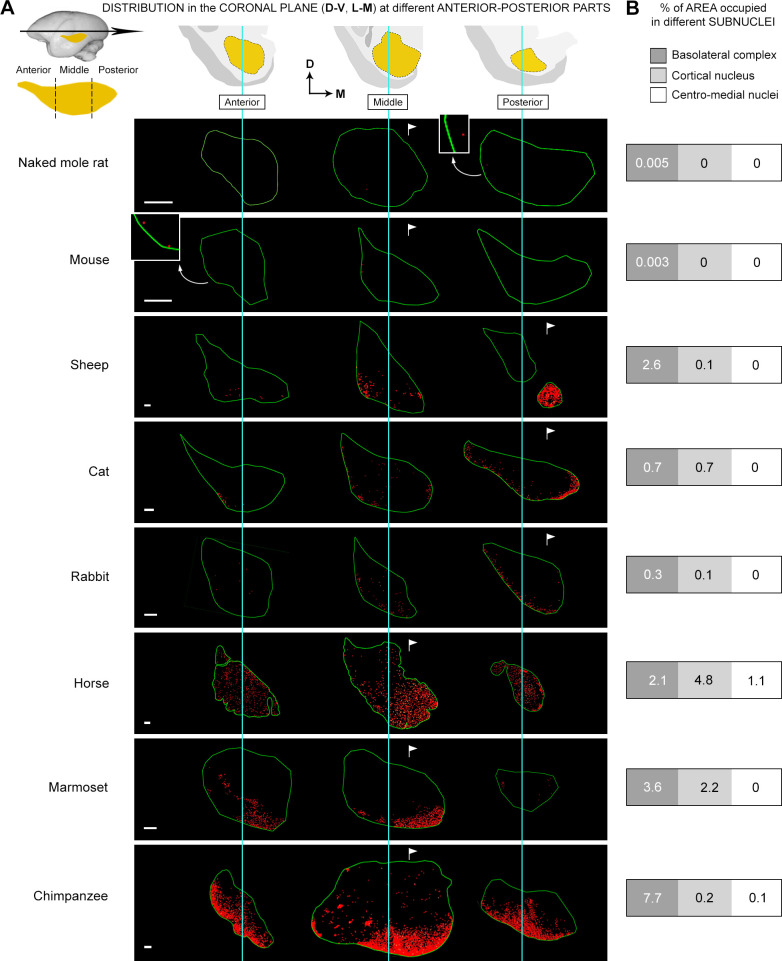
Structural changes involving new neurons can occur through stem cell-driven neurogenesis, and through incorporation of late-maturing "immature" neurons into networks, namely undifferentiated neuronal precursors frozen in a state of arrested maturation. The latter have been found in the cerebral cortex and are particularly abundant in large-brained mammals, covarying with the size of the brain and cortex. Similar cells have been described in the amygdala of some species, although their features and interspecies variation remain poorly understood. Here, their occurrence, number, morphology, molecular expression, age-related changes, and anatomical distribution in amygdala subdivisions were systematically analyzed in eight diverse mammalian species (including mouse, naked mole rat, rabbit, marmoset, cat, sheep, horse, and chimpanzee) widely differing in neuroanatomy, brain size, life span, and socioecology. We identify converging evidence that these amygdala cells are immature neurons and show marked phylogenetic variation, with a significantly greater prevalence in primates. The immature cells are largely located within the amygdala's basolateral complex, a region that has expanded in primate brain evolution in conjunction with cortical projections. In addition, amygdala immature neurons also appear to stabilize in number through adulthood and old age, unlike other forms of plasticity that undergo marked age-related reduction. These results support the emerging view that large brains performing complex socio-cognitive functions rely on wide reservoirs of immature neurons.


Conflict of interest statement

The authors have declared that no competing interests exist.

Figures

Fig 1
Fig 1. Sample of species, ages, and brain regions of the mammals used in this study (further information in S1 Table; animal species are arranged from left to right according to their brain size).
(A, top) Mammalian species and orders (scientific name, common name – used hereafter – and abbreviation) with special reference to their brain size and life span. The pie chart illustrates the distribution of extant and recently extinct mammal species across orders according to the total number of recognized species (based on Wilson and Reeder; [36]; numbers indicate the position of the 6 orders considered here. (A, bottom) Different ages considered for each species, from prepuberal to old aged (see S1 Table for more detail on ages); all groups are composed of four individuals (black squares), and all species are available at the young adult stage (green line). Red shapes on the right are symbols to refer to age groups in the following figures. (B) Color code. (C, D) Brain tissue processing adopted to obtain comparable data in all species (mouse, sheep, and cat are represented as an example); serial coronal sections 40 µm thick of the entire hemisphere of each animal species were placed in multiwell plates to have an interval of 480 µm in each well to analyze the anterior-posterior extension of amygdala, followed by staining of sections and segmentation of the subcortical region based on histology (C, bottom); the final drawings of neuroanatomy in coronal sections are represented in E). (D) Different numbers of sections were obtained in each species depending on the brain size and consequent extension of the amygdala (see also S2 Fig and S4 Table). (F) By using the comparable method described above, volumes of the amygdala and whole hemisphere were calculated in each species. Then, counting of DCX+ cells (immature-appearing neurons) and Ki67+ nuclei (dividing cells) was performed in the amygdala (see S2 Fig). Created with brain icons from https://app.biorender.com/ and images reproduced with permission from Ref. [15]; this article is distributed under the terms of the Creative Commons Attribution License, which permits unrestricted use and redistribution provided that the original author and source are credited. Scale bar: 1,000 µm.
Fig 2
Fig 2. Comparative neuroanatomy of amygdala in all mammals in this study: topology, surrounding structures, and main subnuclei segmentation.
On the left, the amygdala (orange) is represented with its surrounding structures, which can vary depending on the species’ brain size and gyrencephaly (e.g., the amygdalar capsule of white matter is lateral in the amygdala of a mouse, becoming ventral or even ventromedial in primates). For subnuclei segmentation (right), the entire amygdala anterior-posterior length of each species (from 1.4 to 9.6 mm) was analyzed at 480 µm apart (one serial coronal section out of 12 stained with toluidine blue; cresyl violet in chimpanzees; from 3 sections in rodents to 20 sections in horse; see S2 Fig) and matched with atlases and comparative studies available in the literature: ([7,37,38] mouse; [39] naked mole rat; [40,41] rabbit; [28,42] cat; [43,44] sheep; [–47] marmoset; [47,48] chimpanzee; [49], horse). The representation of subnuclei is shown in three parts of the amygdala (anterior, middle, posterior; different nuclei having different lengths) and topologically oriented according to the internal axes (see drawings of a representative middle section on the left). A simplified subdivision common to the eight species has been adopted (see S1 Fig) that was used for DCX+ and Ki67+ cell counting. The paralaminar nucleus has been represented only in species where it has been previously described (mouse and marmoset). Nuclei of the basolateral complex (BLc, including the paralaminar nucleus) are colored in dark gray. This interspecies mini-atlas was used to establish the topological and topographical distribution of the DCX+ and Ki67+ cells in both longitudinal (anterior-to-posterior extension, shown in Fig 6A) and coronal axes (lateral-medial and dorsal-ventral position, Fig 7). Animal species are arranged from top to bottom according to increasing brain size.
Fig 3
Fig 3. Occurrence, morphology, and general distribution of DCX+ cells in the amygdala of mammals.
Red (immunofluorescence) and brown (diaminobenzidine staining; DAB), DCX; blue, DAPI. (A) In all species, the morphological cell types of DCX+ cells were reminiscent of type 1 (very simple morphology) and type 2 (complex cells) immature or dormant neurons described in the cortex [8,15]. (B) At least three types of cell distribution/aggregation were observed, from isolated cells to tightly packed clusters. (C) Confocal fields of DCX+ cells in the amygdala of different mammals after immunofluorescence staining (except for chimpanzee specimens, photographed in light microscopy after DAB staining). Note the presence of scattered, isolated immunoreactive cells in mice with respect to dense, extensive networks in primates (the number of DCX+ cells appeared particularly high in chimpanzees; see internal controls in S3 Fig). Arrowheads indicate some type 2b cells, whose spatial distribution was random. All photographs come from the basolateral complex. Amy, amygdala; Ec, external capsule (amygdalar capsule); arrowheads, examples of type 2b cells. Scale bars: A–C (confocal), 30 µm; C (DAB), 50 µm.
Fig 4
Fig 4. Confocal analysis of different markers in the amygdala of mammals.
(A) Markers of immaturity (DCX and PSA-NCAM, left) are widely distributed and co-expressed in the scIN population; some DCX+ type 2 cells are devoid of PSA-NCAM (red and white arrowheads), while others still express it (yellow arrowhead). Most DCX+ cells, including type 2 cells (red and white arrowheads), do not express the marker for postmitotic neurons that start differentiation NeuN (middle); only a subpopulation of type 2 cells express NeuN, indicating they started the maturation process (yellow arrowheads). Most DCX+ cells also co-express the marker for glutamatergic neurons Tbr1 (right; an enlargement with separate channels for each marker is shown in S4 Fig). (B) Positive (neurogenic sites: subventricular zone, SVZ, and subgranular zone, SGZ; LV, lateral ventricle; red arrowheads) and negative (cerebral cortex) controls for detection of cell division. (B’) Representative images of DCX/Ki67 antigen double staining showing total absence of co-expression in amygdala of any of the species considered. Note the occurrence of “doublets” (double arrow) in the cortical and amygdalar parenchyma. (C) Ki67 antigen staining in amygdala frequently revealed “doublets” (left) and was usually associated with oligodendrocyte progenitor cell division; accordingly, frequent co-expression was detectable in double staining of Ki67 antigen with the glial markers SOX10 and Olig2. All photographs in the amygdala come from the basolateral complex. Scale bars: 30 µm.
Fig 5
Fig 5. Quantification of DCX+ neurons and Ki67+ nuclei in the amygdala of young adult mammals.
(A) Cell density and statistical analysis of DCX+ cells in the amygdala of eight mammalian species (listed in ascending order from left to right; see also the line plot with more extended scale in Fig 6A). A high degree of heterogeneity is detectable from rodents to primates, the latter showing the higher amount. (B) Cell density and statistical analysis of dividing cells in the amygdala of the same animal species and age. A rather minimal homogeneity is detectable, with slight prevalence in rodents and rabbits, and very low levels in primates. Note the sharp contrast between DCX+ neuron abundance (A) and Ki67+ dividing cell scarcity (B) in primates; nonparametric Kruskal-Wallis test, *p < 0.05; **p < 0.01. Tabulated data can be found in S1 Data. (C) Counting of type 1 and type 2 cells (see Figs 3A and S2D); top, cell soma diameter ranges; bottom, percentages are shown in pie charts (numbers indicate the percentage of type 2 cells). (C’) Percentages of DCX+ neurons co-expressing NeuN (cat, rabbit, and marmoset); all co-expressing elements were complex cells (type 2 cells), most of them being type 2b cells (see Fig 4A, and S1 Data). A–C, Mammal species are arranged from left to right according to increasing DCX+ cell density. (D) DCX+ neurons (mostly restricted to the basolateral complex of the amygdala) and Ki67+ dividing cells (widespread in the entire region) have different topographical distribution, suggesting they belong to different populations (example given on marmoset; for other species see Figs 6A and 7). (E) Ancestral character state reconstructions of trait evolution for DCX+ cell density (a), DCX+ cells as a percentage of the basolateral complex of the amygdala (b), and Ki67+ cell density (c) mapped onto the phylogeny. Animal icons reproduced with permission from [15]; this article is distributed under the terms of the Creative Commons Attribution License, which permits unrestricted use and redistribution provided that the original author and source are credited.
Fig 6
Fig 6. Anterior-posterior and coronal (dorsal-ventral, lateral-medial) distribution of the DCX+ cells in the amygdala of mammals.
(A) Line plot indicating the mean total number of DCX+ cells counted in each coronal section in all species. Marked interspecies differences are present in the anterior-posterior distribution: horses and primates show the highest amount in the middle, while cats and sheep have more in the posterior part. Flags indicate the highest number of cells in species showing the highest anterior-posterior differences (mostly gyrencephalic species and primates, indicated here; see S5 Fig for all species). (B) In contrast with the varying anterior-posterior distribution, when observed in the coronal plane, the DCX+ cells of all species appeared consistently associated with the basolateral complex (dark gray area) despite its different topological orientation: from lateral in rodents, to ventral-lateral in marmosets, and ventral (even medial) in chimpanzees. This prompted a more detailed investigation of their distribution within different subnuclei (C). (C) To allocate the immature cells to each of the amygdala subnuclei, the DCX+ cell counting markers were used (see Materials and methods and S3 Table; and Fig 7 for results).
Fig 7
Fig 7. Spatial distribution in the amygdala coronal plane.
(A) Topographical distribution of DCX+ cells within the amygdala of different mammals obtained from placing markers on cells in brain coronal sections used for cell counting (red dots: DCX+ cells; green line: amygdala perimeter). Top, the anterior-to-posterior extension of the amygdala has been split into three parts (anterior, middle, and posterior; see also Figs 2 and S5) to compare the distribution in different coronal planes with that observed in the longitudinal axis. While the DCX+ cell distribution in the anterior-to-posterior extension of the amygdala appeared to be highly heterogeneous among species (Figs 6A and S5), that in the coronal plane was quite constant, being prevalent in the BLc regardless of its topological position (see Figs 2 and 6B). (B) Percentages of areas occupied by the DCX+ cells within the three main amygdala subdivisions (BLc, cortical nucleus, and centro-medial complex), indicating the prevalent association of the INs with nuclei of the basolateral complex (BLc, dark gray), and, to a lesser extent, with the cortical nucleus in large-brained species (horse and chimpanzee; light gray). The invasion of the BLc is particularly evident in primates, sheep, and horses; in addition, despite the representation of amygdala and subnuclei not being in scale, the relative volume of the BLc is far greater in primates than in rodents [45,48], thus making the percentages of areas occupied by the INs even higher. The very small percentages of areas occupied by the INs in rodents do correspond to their highly restricted location within the small paralaminar nucleus, without invading the BLc. Percentages for each of the subnuclei are reported in S3 Table. Mammal species are arranged from top to bottom according to increasing DCX+ cell density (the amount of cells in each field of view is not always representative, especially due to the BLc highly extended both anteriorly and posteriorly).
Fig 8
Fig 8. Quantification of DCX+ neurons, Ki67+ nuclei, and amygdala volumes at different ages.
(A) Cell density and statistical analysis of DCX+ cells in the amygdala of eight mammalian species at different ages (all ages investigated are included; symbols indicating age groups are indicated in Fig 1A). (B) Density and statistical analysis of dividing nuclei in the amygdala of eight animal species (same as in A) at different ages (all ages investigated are included). See enlargements of the A and B plots in S6 Fig, with color code for ages in addition to symbols. (C, D) Amygdala volume estimation. (C) Amygdala/brain volume ratio at all ages investigated; note the substantial invariance of volumetric ratio through different animal species and ages. (D) Amygdala/brain volume ratio at young adult age (top), and amygdala real volumes in each animal species at different ages (bottom); while the absolute volume of the subcortical region is higher in large-brained species (as expected), the volumetric ratio with respect to the whole brain is substantially stable, slightly lower in large-brained ones. A–D, Animal species are arranged from left to right according to increasing DCX+ cell density; nonparametric Mann-Whitney test, #&$*p < 0.05; &&**p < 0.01. (E) Least squares regression of DCX+ cell density against brain volume (a) and amygdala volume (b), with associated residuals of the regressions shown underneath (e and f). Least squares regression of Ki67+ cell density against brain volume (c) and amygdala volume (d), with associated residuals of the regressions shown underneath (g and h). All regression plots are on a log scale and show the 95% prediction intervals. Tabulated data can be found in S1 Data.
Fig 9
Fig 9. Occurrence of subcortical immature neurons (scINs) in the amygdala of mouse and primates: relationship with evolution of subnuclei scaling and cortical connectomics.
(A), The mammalian amygdala can be split into three main parts considering the basolateral complex (BLc; dark gray; here, including the paralaminar nucleus), the cortical nucleus (Co; light gray), and the centro-medial nuclei (CM; white). While CM and Co nuclei do not change substantially in their relative volume among animal species, the BLc is markedly larger in primates (up to 60%–70%) with respect to rodents (around 30%; here not entirely visible since not in scale and because the expansion is linked to the entire anterior-to-posterior volume of the region). Such an expansion has been related to increasing projections to the neocortex typical of primates (large gray arrows; [48,61]; see text). Despite a large difference in the number of scINs (red cells) found in primates with respect to rodents (see Figs 5A, 6A), as well as differences in the anterior-posterior distribution (see Figs 6A and S5), their prevalent occurrence within the basolateral complex is a conserved trait (some scINs were found in the cortical nucleus of horse and marmoset; to a lesser extent in chimpanzee; see Fig 7). While mostly restricted to a very small paralaminar nucleus (PL) in rodents, the scINs largely extend into the BLc in primates (red arrows and Fig 7B). (B) After scIN total amount estimation in the amygdala of each hemisphere (young adult age group, top), chimpanzees possess a reservoir of undifferentiated cells four orders of magnitude higher than mice, and this reservoir is maintained through ages in primates, while decreasing in rodents (bottom; quantitative data extracted from S5 Table). In brackets, average number of DCX+ cells in a coronal section of the amygdala; in bold, estimation of total number of DCX+ cells/hemisphere. YA, young adult; MA, middle age; AG, aged. Created with brain icons from https://app.biorender.com/ and images reproduced with permission from Ref. [15]; this article is distributed under the terms of the Creative Commons Attribution License, which permits unrestricted use and redistribution provided that the original author and source are credited.

Similar articles

References

    1. Gómez-Climent MA, Castillo-Gómez E, Varea E, Guirado R, Blasco-Ibáñez JM, Crespo C, et al. A population of prenatally generated cells in the rat paleocortex maintains an immature neuronal phenotype into adulthood. Cereb Cortex. 2008;18:2229–40. - PubMed
    1. Luzzati F, Bonfanti L, Fasolo A, Peretto P. DCX and PSA-NCAM expression identifies a population of neurons preferentially distributed in associative areas of different pallial derivatives and vertebrate species. Cereb Cortex. 2009;19(5):1028–41. doi: 10.1093/cercor/bhn145 - DOI - PubMed
    1. Bonfanti L, Nacher J. New scenarios for neuronal structural plasticity in non-neurogenic brain parenchyma: the case of cortical layer II immature neurons. Prog Neurobiol. 2012;98(1):1–15. doi: 10.1016/j.pneurobio.2012.05.002 - DOI - PubMed
    1. König R, Benedetti B, Rotheneichner P, O′Sullivan A, Kreutzer C, Belles M, et al. Distribution and fate of DCX/PSA-NCAM expressing cells in the adult mammalian cortex: a local reservoir for adult cortical neuroplasticity? Front Biol. 2016;11:193–213.
    1. Bonfanti L, Seki T. The PSA-NCAM-positive “immature” neurons: an old discovery providing new vistas on brain structural plasticity. Cells. 2021;10:2542. - PMC - PubMed

MeSH terms

LinkOut - more resources