. 2025 Aug 14;22(8):e1004683.
doi: 10.1371/journal.pmed.1004683. eCollection 2025 Aug.

The transmission blocking activity of artemisinin-combination, non-artemisinin, and 8-aminoquinoline antimalarial therapies: A pooled analysis of individual participant data

Affiliations

The transmission blocking activity of artemisinin-combination, non-artemisinin, and 8-aminoquinoline antimalarial therapies: A pooled analysis of individual participant data

Leen N Vanheer et al. PLoS Med. .

Abstract

Background: Interrupting human-to-mosquito transmission is important for malaria elimination strategies as it can reduce infection burden in communities and slow the spread of drug resistance. Antimalarial medications differ in their efficacy in clearing the transmission stages of Plasmodium falciparum (gametocytes) and in preventing mosquito infection. Here, we present a retrospective combined analysis of six trials conducted at the same study site with highly consistent methodologies that allows for a direct comparison of the gametocytocidal and transmission-blocking activities of 15 different antimalarial regimens or dosing schedules.

Methods and findings: Between January 2013 and January 2023, we conducted six clinical trials evaluating antimalarial treatments with transmission endpoints at the Clinical Research Centre of the Malaria Research and Training Centre of the University of Bamako in Mali. These trials tested Artemisinin-Combination Therapies (ACTs), non-ACT regimens and combinations with 8-aminoquinolines. Participants were males and non-pregnant females, between 5 and 50 years of age, who presented with P. falciparum mono-infection and gametocyte carriage by microscopy. We collected blood samples before and after treatment for thick film microscopy, infectivity assessments by mosquito feeding assays and molecular quantification of gametocytes. To combine direct and indirect effects of treatment groups across studies, we performed a network meta-analysis. This analysis quantified changes in mosquito infection rates and gametocyte densities within treatment groups over time and between treatments. In a pooled analysis of 422 participants, we observed substantial differences between antimalarials in gametocytocidal and transmission-blocking activities. Artemether-lumefantrine (AL) was significantly more potent at reducing mosquito infection rates within 48 h than dihydroartemisinin-piperaquine (p = 0.0164) and sulfadoxine-pyrimethamine plus amodiaquine (p = 0.0451), while this difference was near-significant for artesunate-amodiaquine (p = 0.0789) and pyronaridine-artesunate (p = 0.0519). The addition of single low-dose primaquine (SLD PQ) accelerated gametocyte clearance for any ACT and led to a substantially greater reduction in mosquito infection rate within 48 h of treatment for all ACTs except AL, while an SLD of the 8-aminoaquinoline tafenoquine showed a delayed activity, compared to SLD PQ, but was similarly effective. The main limitations of the study include the inclusion of highly infectious individuals, which may not reflect the broader malaria patient population with lower or undetectable gametocyte densities and the small sample sizes in some treatment groups, which resulted in wide confidence intervals and reduced the certainty of effect estimates.

Conclusions: We found marked differences among ACTs and single low-dose 8-aminoquinoline drugs in their ability and speed to block transmission. The findings from this analysis can support treatment policy decisions for malaria elimination and be integrated into mathematical models to improve the accuracy of predictions regarding community transmission and the spread of drug resistance under varying treatment guidelines.


Conflict of interest statement

I have read the journal's policy and the authors of this manuscript have the following competing interests: CD is a member of the Malaria Policy Advisory Group (MPAG). TB contributed to a Guideline Development Group of the World Health Organization for recommendations for the final phase of elimination and prevention of re-establishment of malaria.

Figures

Fig 1
Fig 1. Study design of included trials.
All studies assessed infectivity to mosquitoes before (d0), during (d2) and one week after initiation of treatment (d7) with additional time-points that differed between studies. Tick marks represent days; circles indicate sampling/screening time points. Circles that are encompassed by larger red circles indicate that a standard dose anti-asexual antimalarial was administered at these study visits, while a single low-dose gametocytocide was administered immediately after the first dose of anti-asexual treatment (marked in blue). Grey coloured circles indicate that parasite densities were assessed by both microscopy (asexual parasite and gametocyte densities) and RT-qPCR (gametocyte densities). At other study visits, parasite densities were determined by microscopy only (white circles) or RT-qPCR only (dark grey circles). Mosquito infectivity assays were conducted at the study visits marked with a black mosquito symbol, while a grey mosquito symbol indicates that mosquito infectivity assays were only conducted at that time point if any of the previous two assays resulted in at least one infected mosquito. Mosquito image in this figure is adapted from https://openclipart.org/detail/233084/mosquito, available under a Creative Commons Zero 1.0 Public Domain License.
Fig 2
Fig 2. Baseline study characteristics.
A. Violin plot of microscopy-detected asexual parasite density (parasites/µL) distribution per study. B. Violin plot of microscopy-detected gametocyte density (gametocytes/µL) distribution per study. Apparent truncations in panels A and B reflect characteristics of the data collection process rather than omissions. These arise from (i) inclusion criteria, and (ii) parasite quantification based on reading a fixed fraction of a microliter, which introduces a multiplication factor and results in ‘binning’ of similar parasite densities. C. The mean proportion of mosquitoes that became infected after feeding on venous blood collected at enrolment, prior to treatment, per study. Vertical bars represent 95% Cis estimated from a logistic regression model. D. Results from a logistic regression between microscopy-determined gametocyte densities (gametocytes/ µL) on a log10 scale and the proportion of infected mosquitoes over the different study years shown by the different colours. Mosquito feeding assays in this analysis were conducted before treatment was initiated. The black line indicates the overall trend averaged across all years with the shaded area showing the 95% confidence interval for this overall fit. Visualisations represent a total of 422 observations, from 42 (2013-2014), 60 (2016), 100 (2019), 60 (2020), 60 (2021) and 100 (2022) study participants. The median number of dissected mosquitoes per study participant (panel C) was 71.8 (IQR 65.6-77) for 2013-2014, 79 (IQR 72-84) for 2016, 64 (IQR 57-70) for 2019, 60 (IQR 51.8-66.5) for 2020, 62 (IQR 53.8-64.2) for 2021 and 61 (IQR 55-66) for 2022.
Fig 3
Fig 3. Gametocyte prevalence and densities.
A. Bland-Altman plot presenting agreement between gametocyte density measured by microscopy and RT-qPCR pre-treatment. The solid black line indicates the overall mean difference including all studies, and dotted lines represent 1.96 × standard deviation of the differences. The dashed lines, coloured by study, represent group-specific mean differences. B–D. Bar charts illustrating the relative reduction compared to baseline in gametocyte prevalence by microscopy (B), and gametocyte densities measured by microscopy (C) and molecular methods (D), by treatment group over three time points (Day 2 – indigo, Day 7 – turquoise, and Day 14 – green). Vertical bars depict the 95% confidence intervals for these estimates. Red dots represent observed means. The y-axis was cut off below −50 due to inflated standard errors, as a result of reductions from baseline close to zero or high measurement uncertainty. Visualisations represent data from 422 individuals at baseline (79, 40, 25, 20, 60, 20, 138 and 40 individuals from the DHA-PPQ, SP-AQ, PY-AS, AS-AQ, AL, non-ACT-PQ, ACT-PQ and ACT-TQ groups, respectively). At day 2, 369 individuals were included (65, 39, 23, 20, 58, 19, 105 and 40 individuals from the DHA-PPQ, SP-AQ, PY-AS, AS-AQ, AL, Non-ACT-PQ, ACT-PQ and ACT-TQ groups, respectively). Data from 357 individuals at day 7 is shown (57, 38, 24, 20, 57, 19, 104 and 38 individuals from the DHA-PPQ, SP-AQ, PY-AS, AS-AQ, AL, Non-ACT-PQ, ACT-PQ and ACT-TQ groups, respectively). Day 14 includes data from 357 individuals (60, 38, 24, 19, 57, 18, 105 and 36 individuals from the DHA-PPQ, SP-AQ, PY-AS, AS-AQ, AL, Non-ACT-PQ, ACT-PQ and ACT-TQ groups, respectively).
Fig 4
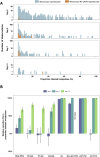
Fig 4. Infectivity of submicroscopic gametocyte infections and the relative reduction in the proportion of infected mosquitoes compared to baseline per treatment category.
A. Stacked bar chart representing the number of observations for each proportion of infected mosquitoes (rounded to the nearest integer) at baseline and at days 2,7 and 14 post-treatment initiation. For each day of follow-up, individual study participants contribute a single observation. Bars are coloured by the presence of gametocytes by microscopy (blue) or by RT-qPCR only (orange). Baseline visualisations represent a total of 422 study participants; per study 42 (2013-2014), 60 (2016), 100 (2019), 60 (2020), 60 (2021) and 100 (2022) participants were enrolled and presented here. At day 2, data from 375 individuals are presented (60, 99, 60, 58, 98 participants from the 2016, 2019, 2020, 2021 and 2022 studies, respectively). At day 7 post-treatment initiation, 367 participants are presented (56, 98, 59, 58 and 97 participants from the 2016, 2019, 2020, 2021 and 2022 studies, respectively). Finally, at day 14, data from 218 individuals are presented (47, 56, 17 and 96 participants from the 2019, 2020, 2021 and 2022 studies, respectively). Y-axis is log-transformed using log(1 + y) to allow visualisation of zero counts. B. Bar chart illustrating the relative reduction compared to baseline in the proportion of infected mosquitoes by treatment group over three time points (Day 2 – indigo, Day 7 – turquoise, and Day 14 – green). Vertical bars depict the 95% confidence intervals for these estimates. Visualisations represent data from 416 individuals at baseline (79, 40, 25, 20, 60, 20, 139 and 40 individuals from the DHA-PPQ, SP-AQ, PY-AS, AS-AQ, AL, non-ACT-PQ, ACT-PQ and ACT-TQ groups, respectively). At day 2, 416 individuals were included (78, 40, 25, 20, 58, 20, 135 and 40 individuals from the DHA-PPQ, SP-AQ, PY-AS, AS-AQ, AL, Non-ACT-PQ, ACT-PQ and ACT-TQ groups, respectively). Data from 409 individuals at day 7 is shown (76, 39, 25, 20, 57, 19, 134 and 39 individuals from the DHA-PPQ, SP-AQ, PY-AS, AS-AQ, AL, Non-ACT-PQ, ACT-PQ and ACT-TQ groups, respectively). Day 14 includes data from 218 individuals (43, 15, 25, 19, 39, 40 and 37 individuals from the DHA-PPQ, SP-AQ, PY-AS, AS-AQ, AL, ACT-PQ and ACT-TQ groups, respectively).
Fig 5
Fig 5. NMA results and between-group comparison of the reduction in proportion infected mosquitoes at days 2 and 7 post-treatment, compared to baseline.
A. Network plot of treatment comparisons. Node size reflects the total number of individuals receiving each treatment, while the thickness of the connecting lines represents the number of studies comparing the connected treatment pairs. B. P-scores, reflecting the relative ranking of treatments (higher scores indicating greater efficacy) for each treatment group on days 2, 7 and 14, ranked by highest p-score on day 2. Values are shown both numerically within each heatmap cell and visually through the colour gradient. C, D. Heatmaps representing the absolute difference between treatment groups in the relative reduction in proportion infected mosquitoes at days 2 (C) and 7 (D) post-treatment, compared to baseline, with 95% CI and p-values. Heatmap cells are coloured by the absolute difference. For example, the absolute difference between DHA-PPQ and AL in the relative reduction in proportion infected mosquitoes at day 2 is −68.10% (−123.69%, −12.51%), and the difference between these groups (68.10% lower reduction for DHA-PPQ) is statistically significant (p = 0.0164). P-values were determined via a two-stage individual participant data network meta-analysis.
Fig 6
Fig 6. Time to clearance of infectivity and gametocytes per treatment category.
Kaplan–Meier survival curves showing the cumulative probability of remaining uncleared of gametocytes detected by microscopy (purple), gametocytes detected by RT-qPCR (turquoise) and infectivity to mosquitoes (green) over time stratified across different antimalarial treatment categories (DHA-PPQ, SP-AQ, PY-AS, AS-AQ, AL, Non-ACT-PQ, ACT-PQ, ACT-TQ). Shaded areas indicate 95% confidence intervals for the Kaplan-Meier survival estimates. Survival curves showing infectivity represent data from 417 individuals (79, 40, 25, 20, 58, 20, 135 and 40 individuals from the DHA-PPQ, SP-AQ, PY-AS, AS-AQ, AL, Non-ACT-PQ, ACT-PQ and ACT-TQ groups, respectively). Survival curves visualising gametocytes by microscopy show data from 375 individuals (65, 40, 25, 20, 58, 20, 107 and 40 individuals from the DHA-PPQ, SP-AQ, PY-AS, AS-AQ, AL, Non-ACT-PQ, ACT-PQ and ACT-TQ groups, respectively) and 417 individuals (79, 40, 25, 20, 58, 20, 135 and 40 individuals from the DHA-PPQ, SP-AQ, PY-AS, AS-AQ, AL, Non-ACT-PQ, ACT-PQ and ACT-TQ groups, respectively) for gametocyte assessment by RT-qPCR.

References

    1. White NJ. Assessment of the pharmacodynamic properties of antimalarial drugs in vivo. Antimicrob Agents Chemother. 1997;41(7):1413–22. doi: 10.1128/AAC.41.7.1413 - DOI - PMC - PubMed
    1. Adjalley SH, Johnston GL, Li T, Eastman RT, Ekland EH, Eappen AG. Quantitative assessment of Plasmodium falciparum sexual development reveals potent transmission-blocking activity by methylene blue. Proc Natl Acad Sci U S A. 2011;108(47):E1214-1223. - PMC - PubMed
    1. Bousema T, Drakeley C. Epidemiology and infectivity of Plasmodium falciparum and Plasmodium vivax gametocytes in relation to malaria control and elimination. Clin Microbiol Rev. 2011;24(2):377–410. doi: 10.1128/CMR.00051-10 - DOI - PMC - PubMed
    1. Stepniewska K, Humphreys GS, Gonçalves BP, Craig E, Gosling R, Guerin PJ, et al. Efficacy of single-dose primaquine with artemisinin combination therapy on Plasmodium falciparum gametocytes and transmission: an individual patient meta-analysis. J Infect Dis. 2022;225(7):1215–26. doi: 10.1093/infdis/jiaa498 - DOI - PMC - PubMed
    1. Bolscher JM, Koolen KMJ, van Gemert GJ, van de Vegte-Bolmer MG, Bousema T, Leroy D, et al. A combination of new screening assays for prioritization of transmission-blocking antimalarials reveals distinct dynamics of marketed and experimental drugs. J Antimicrob Chemother. 2015;70(5):1357–66. doi: 10.1093/jac/dkv003 - DOI - PubMed

MeSH terms

LinkOut - more resources