. 2025 Nov 6;146(19):2350-2356.
doi: 10.1182/blood.2025028985.

Venetoclax plus gilteritinib is effective in preclinical models of FLT3-mutant BCL11B-a lineage-ambiguous leukemia

Affiliations

Venetoclax plus gilteritinib is effective in preclinical models of FLT3-mutant BCL11B-a lineage-ambiguous leukemia

Lindsey E Montefiori et al. Blood. .

Abstract

Aberrant activation of BCL11B (BCL11B-a) defines a subtype of lineage-ambiguous leukemias with T-lymphoid and myeloid features, co-occurring activating FLT3 mutations, and a stem/progenitor immunophenotype and gene expression profile. Similar to other lineage-ambiguous leukemias, optimal treatment is unclear, and there are limited targeted therapeutic options. Here, we investigated the efficacy of B-cell lymphoma 2 (BCL-2) and FMS-like tyrosine kinase 3 (FLT3) inhibition with venetoclax and gilteritinib, respectively, in preclinical models of BCL11B-a leukemia. Despite variation in response to single-agent therapies, the combination of venetoclax plus gilteritinib (VenGilt) was highly effective in all models evaluated. BH3 profiling suggested that resistance to venetoclax monotherapy was due to the tumor-intrinsic dependence on additional BCL-2 family proteins before drug treatment. Longitudinal single-cell RNA sequencing analysis identified mitochondrial pathways and a pro-lymphoid gene expression signature as potential drivers of rare cell survival on VenGilt therapy. These data support clinical evaluation of venetoclax in combination with gilteritinib in BCL11B-a lineage-ambiguous leukemias.


Figures

Figure 1.
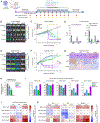
Figure 1.. BH3 profiling demonstrates baseline dependence on BCL-2 in BCL11B-a PDX models.
(A) Summary created using Biorender.com of the three BCL11B-a PDX models studied. The BCL11B structural variant and enhancer hijacking partner are indicated, along with co-occurring mutations identified in each diagnostic sample (BETA; BCL11B enhancer tandem amplification). Luc+ indicates the PDX cells express luciferase to enable in vivo bioluminescent imaging. (B) Representative flow plots of each PDX’s immunophenotype are shown. cyCD3, cytoplasmic CD3; cyMPO, cytoplasmic myeloperoxidase. See also supplemental Table 2. (C) Schematic of BH3 profiling. Shaded boxes indicate the affinity of each BH3 peptide or mimetic (rows) to bind and inhibit each BCL-2 family protein (columns). The histograms below show representative results of Cytochrome c release following treatment with BAD peptides. As BAD peptide inhibits both BCL-2 and BCL-xL, sensitivity to BCL-2 inhibition is indicated by increased depolarization following treatment with BAD peptide compared to HRK peptide (D,E) Baseline mitochondrial depolarization induced by each treatment in each PDX model. HEL cells are an erythroleukemia cell line with known sensitivity to BCL-xL inhibition and were included as a positive control for HRK peptide activity. The bar plot (D) shows the percentage of PDX blasts in the Cytochrome c-negative gate following peptide exposure while the heatmap in (E) shows delta priming values of the same experiments (delta priming = % Cytochrome c release [treatment] - % Cytochrome c release [DMSO]). Ala, alamethicin (positive control). Data shown for two independent experiments on PDX cells from two different mice. (F) Heatmap of delta priming values for PDX samples treated with BH3 mimetic drugs. Data are representative of 3 replicates. (G) Ex vivo cell viability of each PDX following 48 hours of exposure to the BH3 mimetic drugs ABT-199 (venetoclax), ABT-263 (navitoclax), S63845 (MCL1 inhibitor), and A-1155463 (BCL-xL inhibitor). Data are representative of two independent experiments.
Figure 2.
Figure 2.. VenGilt therapy is effective in vivo in BCL11B-a PDX models.
(A) Schematic created using Biorender.com of in vivo drug treatment of BCL11B-a PDX models. See also supplemental Table 3. (B,C) In vivo bioluminescent imaging (B) and quantitation (C) from SJAUL068292 PDX mice. Due to unexpected loss of animals from the venetoclax-only arm, 2 animals from each treatment group were sacrificed at 4 weeks to have matched engraftment and immunophenotype data (see Supplemental Table 3). (D) Leukemic burden in the BM and SPL at the indicated time points of SJTALL005187 PDX mice. (E,F) In vivo bioluminescent imaging (E) and quantitation (F) from SJMPAL011911 PDX mice Circled data points in panel F indicate re-treatment. (G) Immunohistochemistry for human (h)CD7 and hCD33 on BM sections from a representative SJMPAL011911 PDX mouse of each treatment group following 4 weeks of treatment. (H) Leukemic burden in the BM of SJMPAL011911 PDX mice following 4 weeks of treatment. This cohort represents an independent study from that shown in panels E,F. Two representative samples from this study were used in BH3 profiling experiments (panels I-K). (I-K) Results from BH3 profiling of residual leukemic cells from the BM of SJMPAL011911 PDX mice following 4 weeks of treatment. Data shown are for two biological replicates. (I) Percentage of cells showing evidence of mitochondrial depolarization (% Cytochrome c release) following treatment with each indicated peptide; (J,K) Log2 fold change in delta priming values (% Cytochrome c release [treatment] - % Cytochrome c release [DMSO]) of each treatment group compared to vehicle. Panel K shows these data for the CD33+ and CD33- population separately. o.d., omne die (once daily); IP, immunophenotype; BM, bone marrow; SPL, spleen; H&E, Hematoxylin and eosin.
Figure 3.
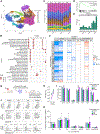
Figure 3.. Single-cell profiling of BCL11B-a acute leukemia PDX reveals transcriptional pathways associated with drug response.
(A) Uniform Manifold Approximation and Projection (UMAP) visualization of all scRNA-seq samples and time points from the SJMPAL011911 PDX in vivo treatment study. Cells are colored according to their Seurat-defined gene expression cluster. (B) Gene set enrichment analysis (GSEA) of differential expression between each cluster from Seurat analysis and all other clusters. [R] indicates Reactome Gene Set; [H] indicates Hallmark Gene Set (C) Stacked bar plot of cluster composition within each sample. (D) GSEA result of a B-lymphocyte gene program that is enriched in Cluster 8 compared to all other clusters. (E) The percentage of cells from each sample mapped to Cluster 8. (F) Selected GSEA results of each treatment compared to the time-point-matched vehicle sample. Gene sets within each category are ranked by the significance of the VenGilt vs. vehicle 24-hour timepoint. See also supplemental Table 6. (G) Schematic showing that residual SJMPAL011911 leukemic cells from one mouse of each treatment group were harvested and transplanted into subsequent recipients (N=3 recipient mice per drug-treated donor sample; see Methods) to measure engraftment kinetics, resulting tumor immunophenotype, and subsequent ex vivo drug sensitivity. (H) Engraftment as measured by total bioluminescent signal at 6- and 10- weeks post-transplant. (I) Bar plots quantifying the percentage of live, single hCD45+ cells positive for each marker shown across all recipient mice. Significance assessed with a two-way ANOVA with multiple testing correction using the Tukey method. *p<0.05 **p<0.01 ***p<0.001. (J) Representative flow cytometry plots of one mouse per recipient group. Data shown are gated on live, single, hCD45+ cells. (K) Ex vivo drug treatment of engrafted tumors from the bone marrow of recipient mice. Data shown represent the percentage of live (Annexin-V and propidium iodine double-negative) hCD45+ cells relative to DMSO treatment alone. Bars are colored according to the in vivo drug treatment of the original tumor. X-axis labels indicate ex vivo drug treatment. Concentrations used for all treatments were: venetoclax (ven), 50 nM; gilteritinib (gilt), 1 μM; S63845 (S6), 50 nM. Cells were treated for 48 hours. Mito., mitochondria; DNA dam., DNA damage; Hypx, hypoxia; Onc; Oncogene

Comment in

References

    1. Montefiori LE, Bendig S, Gu Z, et al. Enhancer hijacking drives oncogenic BCL11B expression in lineage-ambiguous stem cell leukemia. Cancer Discov. 2021;11(11):2846–2867. - PMC - PubMed
    1. Di Giacomo D, La Starza R, Gorello P, et al. 14q32 rearrangements deregulating BCL11B mark a distinct subgroup of T-lymphoid and myeloid immature acute leukemia. Blood. 2021;138(9):773–784. - PMC - PubMed
    1. Choi JK, Xiao W, Chen X, et al. Fifth Edition of the World Health Organization Classification of Tumors of the Hematopoietic and Lymphoid Tissues: Acute Lymphoblastic Leukemias, Mixed-Phenotype Acute Leukemias, Myeloid/Lymphoid Neoplasms With Eosinophilia, Dendritic/Histiocytic Neoplasms, and Genetic Tumor Syndromes. Modern Pathology. 2024;37(5):100466. - PubMed
    1. Ni Chonghaile T, Roderick JE, Glenfield C, et al. Maturation stage of T-cell acute lymphoblastic leukemia determines BCL-2 versus BCL-XL dependence and sensitivity to ABT-199. Cancer Discov. 2014;4(9):1074–1087. - PMC - PubMed
    1. Olesinski EA, Bhatia KS, Mahesh AN, et al. BH3 profiling identifies BCL-2 dependence in adult patients with early T-cell progenitor acute lymphoblastic leukemia. Blood Adv. 2023;7(12):2917–2923. - PMC - PubMed

MeSH terms