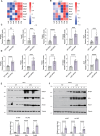
. 2025 Aug 14;16(1):7570.
doi: 10.1038/s41467-025-63022-z.

Dysregulation of GTPase-activating protein-binding protein1 in the pathogenesis of metabolic dysfunction-associated steatotic liver disease

Affiliations

Dysregulation of GTPase-activating protein-binding protein1 in the pathogenesis of metabolic dysfunction-associated steatotic liver disease

Qinqin Ouyang et al. Nat Commun. .

Abstract

Metabolic dysfunction-associated steatotic liver disease (MASLD) and metabolic dysfunction-associated steatohepatitis (MASH) are two common liver disorders characterized by abnormal lipid accumulation. Our study found reduced levels of GTPase-activating protein-binding protein1 (G3BP1) in patients with MASLD and MASH, suggesting its involvement in these liver disorders. Hepatocyte-specific G3BP1 knockout (G3BP1 HKO) male mice had more severe MASLD and MASH than their corresponding controls. Intriguingly, the G3BP1 HKO MASLD model male mice exhibit dysregulated autophagy, and biochemical analyses demonstrated that G3BP1 promotes autophagosome-lysosome fusion through direct interactions with the SNARE proteins STX17 and VAMP8. We also show that hepatic knockout of G3BP1 promotes de novo lipogenesis, and ultimately found that G3BP1 is required for the nuclear translocation of the well-known liver-lipid-regulating transcription factor TFE3. Taken together, our results suggest that G3BP1 should be investigated as a potential target for developing medical interventions to treat MASLD and MASH.


Conflict of interest statement

Competing interests: The authors declare no competing interests.

Figures
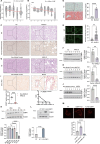
Fig. 1
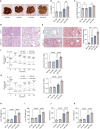
Fig. 1. Aberrantly low expression of G3BP1 in the livers of MASLD patients and MASLD and MASH.
Violin plots for G3BP1 expression (log2CPM) in the GSE162694 and GSE126848 dataset, in which patients were stratified by fibrosis score (A) or NAS (B); healthy control group: n = 31; MASLD group: n = 112; The reads were mapped to the Ensembl human (hg19/GRCh37) reference genomes using HISAT2. The gene expression was normalized to CPM (Counts per million reads) using edgeR. R package DESeq2 was used to screen the differential expression genes (DEGs) between samples with a criteria of adjusted P value < 0.05. CE Representative liver sections from one healthy control (HC) individual and one MASLD patient. C H&E staining was performed to assess liver histopathology (top panel), and immunohistochemistry (IHC) to assess G3BP1 expression in liver tissues from HC and MASLD patients (bottom panel). Scale bars: 50 μm. D Representative Oil Red O staining in liver sections. Scale bars: 50 μm. Oil Red O staining quantification was performed using ImageJ. Bar graphs show the mean ± SEM of the percentage of Oil-red positive areas (n = 4 patients per group). Each dot represents the average value from 10 images collected per patient. ****p < 0.0001 by two-tailed unpaired t-test ****p < 0.0001 by two-tailed unpaired t-test. E Representative immunofluorescence images (G3BP1 staining) in liver sections from HC and MASLD patients. Scale bars: 10 μm. G3BP1 intensity per cell was quantified by Image-J and are presented as mean ± SEM (50 cells analyzed from 4 patients per group). **p  <  0.01, ***p  <  0.001 by two-tailed unpaired t-test. F Immunoblotting against G3BP1 in extracts from liver samples of 4 healthy controls (n = 4) and 4 MASLD patients (n = 4). Quantitative result of G3BP1 protein fold change (G3BP1 expression level verses tubulin expression level) in Fig. 1F. Data are presented as mean ± SEM. **p  <  0.01, ***p  <  0.001 by two-tailed unpaired t-test. G Liver samples were collected from C57BL/6J mice fed a standard chow diet (control, n  =  6) or a high-fat diet (HFD, n  =  6) for 20 weeks. Histopathological evaluation was performed through hematoxylin and eosin (H&E) staining of liver sections from control and MASLD model groups. Scale bars, 50 μm. H Immunoblotting against G3BP1 in liver tissue lysates from control (n  =  4) and MASLD model mice (n  =  4), with quantification of protein levels normalized to Tubulin. Data are presented as mean ± SEM. *p  <  0.05, **p  <  0.01, ***p  <  0.001 by two-tailed unpaired t-test. I Liver samples from C57BL/6J mice fed a standard chow diet (control, n  =  6) or high-fat high-cholesterol diet (HFHC, n  =  6) for 24 weeks were processed for histopathological analysis. Picrosirius red staining of liver sections showing fibrotic progression in MASLD model mice. Data expressed as mean ± SEM, ***p < 0.001 by two-tailed Student’s t-test. Scale bars, 50 μm. J Immunoblot against G3BP1 in liver tissue lysates from control (n  =  4) and MASH model mice (n  =  4), with quantification of protein levels normalized to Tubulin. Data expressed as mean ± SEM. ****p < 0.0001 by two-tailed unpaired t-test. K Primary hepatocytes from C57BL/6J mice (8-week male, n = 6 biologically independent samples) were treated with palmitic acid and oleic acid (PO) for indicated durations (0, 6, 12 h). Immunoblot of G3BP1 with Tubulin loading control. Densitometric quantification normalized to Tubulin. Data expressed as mean ± SEM. *p  <  0.05, **p  <  0.01, ***p  <  0.001 by two-way ANOVA. L FLAG-G3BP1 overexpression and CRISPR/Cas9-mediated knockout in HepG2 cells, with immunoblot analysis using anti-G3BP1 antibodies showing engineered protein expression and endogenous depletion, normalized to Tubulin; (n = 3, three independent experiments). ****p < 0.0001 by one-way ANOVA. M Representative images of Nile red staining in WT, FLAG-G3BP1 overexpression, and G3BP1 KO HEPG2 cells treated with PO for 12 h. Scale bars, 5 μm. Percentage of Nile red positive area was quantified by Image-J. All values are presented as mean ± S.E.M. (n = 5). Each dot represents the average value from 6 images collected per independent experiment. ****P < 0.0001, analysis of one-way ANOVA.
Fig. 2
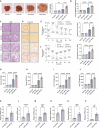
Fig. 2. Conditional hepatic deletion of G3BP1 exacerbates HFD-induced MASLD.
A Liver gross morphology of wild-type (WT) and G3BP1 LKO mice fed normal chow (NC) or high-fat diet (HFD) for 20 weeks (n = 6), imaged by Nikon SMZ25 stereomicroscope. Liver weight (B) and liver-to-body weight ratio (C) of WT and G3BP1 LKO mice fed normal chow (NC) or HFD for 20 weeks (n = 6 mice per group). All values are presented as means ± S.E.M. Statistical analysis was performed using two-way ANOVA followed by Sidak’s multiple comparisons test (two-sided). *P < 0.05; **P < 0.01. D H&E-stained liver sections from WT and G3BP1 LKO mice fed NC or HFD for 20 weeks (n = 6), imaged using Leica microscope. Scale bars: 50 µm. E Representative images of liver sections stained with Oil red staining from G3BP1 LKO and WT mice that were fed NC or HFD for a duration of 20 weeks (n = 6 mice per group). Scale bars, 50 µm. The right panels depict the percentage of Oil red positive area of liver sections from indicated groups, analyzed using ImageJ. Data are presented as means ± S.E.M. (n = 6 mice per group). Each dot represents the average value from 10 images collected per mice. ****P < 0.0001 by two-way ANOVA followed by Sidak’s post hoc test for multiple comparisons (two-sided). F Glucose tolerance tests (GTT) were performed in G3BP1 LKO and WT mice after NC or HFD consumption, and the corresponding AUC values were calculated (n = 6 mice per group). All values are presented as means ± S.E.M. Statistical analysis was performed using two-way ANOVA followed by Sidak’s post hoc test for multiple comparisons (two-sided). Exact p values are shown in the figure. *: WT-NC vs. WT-HFD; #: LKO-HFD vs. WT-HFD. G Insulin tolerance test (ITT) assays data for the non-model control and MASLD model G3BP1 LKO and WT mice, and the AUC (area under the curve) values were calculated accordingly (n = 6 mice per group). All values are presented as means ± S.E.M. Statistical analysis was performed using two-way ANOVA followed by Sidak’s post hoc test for multiple comparisons (two-sided). Exact p values are shown in the figure. *: WT-NC vs. WT-HFD; #: LKO-HFD vs. WT-HFD. Hepatic total cholesterol (TC, H) and triglycerides (TG, I) quantified by enzymatic colorimetric assays in WT and G3BP1 LKO mice under NC or MASLD model induced by HFD for 20 weeks (n = 6 mice per group); All values are presented as means ± S.E.M. ****P < 0.0001, analysis of two-way ANOVA followed by Sidak’s post hoc test for multiple comparisons (two-sided). Serum alanine aminotransferase (ALT, J) and aspartate aminotransferase (AST, K) concentrations quantified by enzymatic assays in WT and G3BP1 LKO mice under NC or MASLD model induced by HFD for 20 weeks (n = 6 mice per group); All values are presented as means ± S.E.M. ****P < 0.0001, analysis of two-way ANOVA followed by Sidak’s post hoc test for multiple comparisons (two-sided).
Fig. 3
Fig. 3. Conditional hepatic deletion of G3BP1 exacerbates HFHC-induced MASH.
A Gross hepatic morphology and liver weight quantification (right panels) of WT and G3BP1 LKO mice fed NC or high-fat high-cholesterol diet (HFHC) for 24 weeks (n = 6 mice per group). All values are presented as means ± S.E.M. *P < 0.05; ****P < 0.0001, analysis of two-way ANOVA followed by Sidak’s post hoc test for multiple comparisons (two-sided). B The liver/body weight ratio of G3BP1 LKO and WT mice after NC or HFHC consumption for 24 weeks (n = 6 mice per group). All values are presented as means ± S.E.M. ****P < 0.0001, ***P < 0.001, analysis of two-way ANOVA followed by Sidak’s post hoc test for multiple comparisons (two-sided). C Representative H&E-stained liver sections from WT and G3BP1 LKO mice fed NC or HFHC for 24 weeks (n = 6), imaged by Leica microscope (scale bars: 50 µm). D Sirius red-stained liver sections from WT and G3BP1 LKO mice fed NC or HFHC for 24 weeks (n = 6), imaged by Leica microscope (scale bars: 50 µm). E Intraperitoneal glucose tolerance tests (GTT) in WT and G3BP1 LKO mice fed NC or HFHC for 24 weeks (n = 6 mice per group), with blood glucose monitored at 0/15/30/60/90/120 min and area under curve (AUC) calculated by trapezoidal method. All values are presented as means ± S.E.M. Statistical analysis was performed using two-way ANOVA followed by Sidak’s post hoc test for multiple comparisons (two-sided). Exact p values are shown in the figure. *: WT-NC vs. WT-HFHC; #: LKO-HFHC vs. WT-HFHC. F Intraperitoneal insulin tolerance tests (ITT) in WT and G3BP1 LKO mice fed NC or HFHC for 24 weeks (n = 6 mice per group), with blood glucose monitored at 0/15/30/60/90 min and area under curve (AUC) calculated by trapezoidal method; All values are presented as means ± S.E.M. Statistical analysis was performed using two-way ANOVA followed by Sidak’s post hoc test for multiple comparisons (two-sided). Exact p values are shown in the figure. *: WT-NC vs. WT-HFHC; #: LKO-HFHC vs. WT-HFHC. ALT (G) and AST (H) concentrations measured in WT and G3BP1 LKO mice fed NC or HFHC for 24 weeks (n = 6 mice per group), All values are presented as means ± S.E.M. ****P < 0.0001, analysis of two-way ANOVA followed by Sidak’s post hoc test for multiple comparisons (two-sided). The liver TC (I) and TG (J) levels of the G3BP1 LKO and WT mice fed normal control diet or HFHC (n = 6 mice per group). All values are presented as means ± S.E.M. ****P < 0.0001, analysis of two-way ANOVA followed by Sidak’s post hoc test for multiple comparisons (two-sided). KP Quantitative RT-PCR analysis of fibrogenesis-related genes (Acta2, Col1a1, Tgfb1, Timp1) and inflammatory markers (Tnf-α, Il6) in liver tissues from WT and G3BP1 LKO mice with MASH induced by 24-week HFHC diet (n = 6 mice per group). Gene expression was normalized to Gapdh and is presented as mean ± S.E.M. Statistical significance was assessed using unpaired two-tailed Student’s t-test. Exact p values are as follows: (K)Acta2, ***P = 0.0008; (L)Col1a1, **P = 0.0015; (M)Tgfb1, ****P < 0.0001; (N) Timp1, ***P = 0.0007; (O) Tnf-α, ***P = 0.0010; (P)Il6, ***P = 0.0003.
Fig. 4
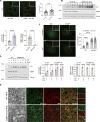
Fig. 4. The fusion between autophagosomes and lysosomes is impaired in the G3BP1 LKO MASLD model.
A Representative immunofluorescence staining images of LC3 (green) of the liver sections from G3BP1 LKO and WT mice fed with HFD for 20 weeks (n = 6 mice per group). The right panel shown the quantification result of LC3 puncta number per cell. Scale bars: 5 μm. All values are presented as means ± SD (at least 40 cells analyzed from 6 mice per group). Statistical significance was assessed using unpaired two-tailed Student’s t-test. ****P < 0.0001. B Western blot analysis of LC3 and G3BP1 in liver lysates from WT and G3BP1 LKO mice fed HFD for 20 weeks (n = 6 mice per group). The lower panels shown the densitometric quantification of LC3 and G3BP1 normalized to Tubulin. Data expressed as mean ± SEM. Statistical significance was assessed using unpaired two-tailed Student’s t-test. ****P < 0.0001. C HEPG2 cells were transfected with either control siRNA or siG3BP1 for 48 h, followed by incubation in standard culture medium or exposure to 100 nM Torin1 for 2 h. LC3 was assessed through immunofluorescence staining using an LC3-specific antibody, with quantitative analysis (right panel) reflecting LC3-positive puncta counts per cell under fluorescence microscopy. Scale bars: 10 μm. All values are presented as means ± S.E.M (at least 50 cells analyzed per group across three biological replicates). ****P < 0.0001, analysis of two-way ANOVA followed by Sidak’s post hoc test for multiple comparisons (two-sided). D HEPG2 cells transfected with control siRNA or siG3BP1 were treated with 100 nM Torin1 ± 20 mM chloroquine (CQ) for 2 h followed by western blot analyses. The right panels shown the quantification result of LC3II and G3BP1 intensity normalized to tubulin. Data are presented as means ± S.E.M (n = 3, three independent experiments). ****P < 0.0001, analysis of unpaired two-tailed Student’s t-test. E Representative confocal images of AAV-delivered mRFP-GFP-LC3 fluorescence in HFD-fed WT and G3BP1 LKO livers. Yellow puncta (GFP+/RFP+ co-localization) signify impaired autophagosome-lysosome fusion. Transmission electron microscopy (TEM) of liver sections from HFD-fed WT and G3BP1 LKO mice, revealing markedly increased autophagosome density in G3BP1 LKO hepatocytes, indicative of defective autophagic flux. Scale bars, 10 μm. Each experiment was repeated independently at least three times.
Fig. 5
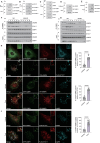
Fig. 5. G3BP1 functions together with SNARE to promote autophagosome-lysosome fusion.
A Co-immunoprecipitation (IP) of HA-G3BP1 and FLAG-VAMP8. HEK293T cells were transfected with an empty vector or HA-G3BP1 with Flag-VAMP8. After 24 h of transfection, cell lysates were subjected to immunoprecipitation using an anti-Flag beads. Each experiment was repeated independently at least three times. B Co-immunoprecipitation (IP) of HA-STX17 and FLAG-G3BP1. HEK293T cells were transfected with an empty vector or HA-STX17 with Flag-G3BP1. After 24 h of transfection, cell lysates were subjected to immunoprecipitation using an anti-Flag beads. Each experiment was repeated independently at least three times. C Co-IP of HEK293T cells transfected with FLAG-G3BP1. HEK293T cells were transfected with empty vector and Flag-G3BP1. 24 h after transfection, cells lysates were immunoprecipitated with anti-Flag beads. VAMP8 and STX17 antibodies were utilized to detected the endogenous proteins. Each experiment was repeated independently at least three times. D, E Glutathione Sepharose beads were used to bind GST or GST-G3BP1, which were then incubated with purified His-tagged VAMP8(D) or STX17(E) for 12 h. The eluted samples were subsequently subjected to immunoblotting. Each experiment was repeated independently at least three times. F G3BP1-STX17/VAMP8 interaction in murine MASLD livers. Male 8-week-old WT and G3BP1 LKO mice were fed with HFD ad libitum for 20 weeks to induce MASLD (n = 6). Control cohorts received normal diet (ND). Co-IP of G3BP1 and STX17/VAMP8 in hepatic tissues from control and MASLD mice. Lysates from liver homogenates were immunoprecipitated with anti-G3BP1 antibody, followed by immunoblotting for STX17/VAMP8. Each experiment was repeated independently at least three times. G G3BP1-VAMP8 interaction in murine MASH livers. Male 8-week-old WT and G3BP1 LKO mice were fed with HFHC ad libitum for 24 weeks to induce MASH (n = 6). Control cohorts received normal diet (ND). Co-IP of G3BP1 and STX17/VAMP8 in hepatic tissues. Liver lysates were immunoprecipitated with anti-G3BP1 antibody and immunoblotted for STX17/VAMP8. Each experiment was repeated independently at least three times. H HEPG2 cells were transfected with GFP-G3BP1, CR-VAMP8, and FLAG-STX17 in the presence or absence of Torin1 for 2 h followed by confocal immunofluorescence microscopy. Scale bars, 10 μm. I HEPG2 cells were transfected with GFP-G3BP1 and CR-VAMP8 and were stained with an antibody against LAMP2 in the presence or absence of Torin1 for 2 h, followed by confocal immunofluorescence microscopy. Scale bars, 10 μm. J HEPG2 cells were transfected with GFP-G3BP1 and FLAG-STX17 and stained with an antibody against LAMP2 in the presence or absence of Torin1 for 2 h, followed by confocal immunofluorescence microscopy. Scale bars: 10 μm. In all statistical plots, the data are presented as means ± S.E.M (at least 30 cells analyzed per group across three independent experiments). For panels (H), (I) and (J), statistical significance was assessed using unpaired two-tailed Student’s t-test. ****P < 0.0001.
Fig. 6
Fig. 6. Hepatic knockout of G3BP1 KO exacerbates HFD-induced MASLD and HFHC-induced MASH in mice by promoting a de novo lipogenesis transcriptional program.
Male 8-week-old WT and G3BP1 LKO mice fed HFD for 20 weeks (MASLD model, A) or HFHC for 24 weeks (MASH model, B). Liver mRNA were extracted and subjected to RNA-seq analysis (n = 3). Heatmap of RNA-seq data showing Z-score-normalized expression of de novo lipogenesis-related genes (Srebp1c, Acss2, Acaca, Chrebpa, and Scd1). C, D qPCR of de novo genesis genes of Srebp1c, Acss2, Acaca, Chrebpa, and Scd1 in liver tissues from the same experimental groups shown in panels A and B (n = 6 mice per group). Gapdh served as a normalization control. All values are presented as means ± SD. *P < 0.05; **P < 0.01; ***P < 0.001; ****P < 0.0001, analysis of unpaired two-tailed Student’s t-test. Male 8-week-old WT and G3BP1 LKO mice fed HFD for 20 weeks (MASLD model, E) or HFHC for 24 weeks (MASH model, F). Representative immunoblots show protein levels of SREBP1, ACLY, and ACSS2 with Tubulin as loading control (n = 6 mice per group). All values are presented as means ± S.E.M. ****P < 0.0001, analysis of two-tailed unpaired t-test.
Fig. 7
Fig. 7. G3BP1 is required for de novo lipogenesis.
A Male 8-week-old WT and G3BP1 LKO mice fed HFD for 20 weeks (MASLD model, n = 6 mice per group). Liver cryosections were fixed in 4% paraformaldehyde and subjected to immunofluorescence staining using TFE3 antibody. Nuclei were counterstained with DAPI. Scale bar: 10 μm. B Cytoplasmic and nuclear fractions were isolated from livers of male 8-week-old WT and G3BP1 LKO mice fed HFD for 20 weeks. Fraction purity was validated by immunoblotting with anti-Histone H3 for nuclear markers. Parallel blots were probed with anti-TFE3, anti-Tubulin, and anti-G3BP1. Each experiment was repeated independently at least three times. C Liver lysates from male 8-week-old WT and G3BP1 LKO mice fed HFD for 20 weeks were resolved by SDS-PAGE for Western blot analysis (n = 4). Membranes were probed with anti-INSIG2, anti-SREBP1 and anti-G3BP1. ACTIN served as loading control. D 8-week-old G3BP1 LKO male mice were intravenously injected with AAV8-Control or AAV8-TFE3 (2 × 1011 viral genomes/mouse) and maintained on HFD for 20 weeks. Representative liver sections stained with H&E (left panels) and Oil Red O (right panels) are shown. Scale bars: 50 μm. n = 6 biologically independent mice per group. Hepatic triglyceride (TG, E) and total cholesterol (TC, F) levels in AAV8-treated G3BP1 LKO mice (n = 6 mice per group). All values are presented as means ± S.E.M. Statistical significance was assessed using unpaired two-tailed Student’s t-test. Exact P value for TG (Panel E), *P = 0.012; TC (Panel F), **P = 0.0042. Serum ALT (G) and AST (H) activities in the indicated groups (n = 6 mice per group). All values are presented as means ± S.E.M. Statistical significance was assessed using unpaired two-tailed Student’s t-test. Exact P value for ALT (panel G), **P = 0.0062; for AST (panel H), **P = 0.0012.

References

    1. Rinella, M. E. et al. A multisociety Delphi consensus statement on new fatty liver disease nomenclature. Ann. Hepatol.29, 101133 (2024). - PubMed
    1. Friedman, S. L. et al. Mechanisms of NAFLD development and therapeutic strategies. Nat. Med24, 908–922 (2018). - PMC - PubMed
    1. Loomba, R. & Sanyal, A. J. The global NAFLD epidemic. Nat. Rev. Gastroenterol. Hepatol.10, 686–690 (2013). - PubMed
    1. Anstee, Q. M., Targher, G. & Day, C. P. Progression of NAFLD to diabetes mellitus, cardiovascular disease or cirrhosis. Nat. Rev. Gastroenterol. Hepatol.10, 330–344 (2013). - PubMed
    1. Byrne, C. D. & Targher, G. NAFLD: a multisystem disease. J. Hepatol.62, S47–S64 (2015). - PubMed

MeSH terms

Substances

LinkOut - more resources