. 2025 Aug 14;16(1):7566.
doi: 10.1038/s41467-025-62818-3.

Large-scale CRISPR screening in primary human 3D gastric organoids enables comprehensive dissection of gene-drug interactions

Affiliations

Large-scale CRISPR screening in primary human 3D gastric organoids enables comprehensive dissection of gene-drug interactions

Yuan-Hung Lo et al. Nat Commun. .

Abstract

Understanding how genes influence drug responses is critical for advancing personalized cancer treatments. However, identifying these gene-drug interactions in a physiologically relevant human system remains a challenge, as it requires a model that reflects the complexity and heterogeneity among individuals. Here we show that large-scale CRISPR-based genetic screens, including knockout, interference (CRISPRi), activation (CRISPRa), and single-cell approaches, can be applied in primary human 3D gastric organoids to systematically identify genes that affect sensitivity to cisplatin. Our screens uncover genes that modulate cisplatin response. By combining CRISPR perturbations with single-cell transcriptomics, we resolve how genetic alterations interact with cisplatin at the level of individual cells and uncover an unexpected link between fucosylation and cisplatin sensitivity. We identify TAF6L as a regulator of cell recovery from cisplatin-induced cytotoxicity. These results highlight the utility of human organoid models for dissecting gene-drug interactions and offer insights into therapeutic vulnerabilities in gastric cancer.


Conflict of interest statement

Competing interests: C.J.K. declares outside interest in Surrozen, Inc., Mozart Therapeutics, and NextVivo, Inc. J.S.W. declares outside interest in KSQ Therapeutics, Maze Therapeutics, Chroma Medicine, Amgen, Tessera Therapeutics, 5AM Ventures, and Third Rock Ventures. J.S.W. has filed patent applications related to CRISPRi and CRISPRa screening. J.C. is an employee and shareholder of Altos Labs. The remaining authors declare no competing interests.

Figures

Fig. 1
Fig. 1. CRISPR KO screen in TP53/APC DKO oncogene-engineered human gastric organoids.
A Establishment of a stable Cas9-expressing engineered TP53/APC DKO human gastric organoid line. Cas9 expression was confirmed by immunoblot analysis. B Highly efficient CRISPR/Cas9 cleavage in Cas9-expressing organoids. A lentiviral construct that contains a GFP-targeting sgRNA was delivered into organoids to deplete the GFP reporter in the same construct. GFP-positive cells were quantified by flow cytometry. C Timeline of CRISPR KO screens. CRISPR KO screens were conducted as two completely independent experiments, involving separate lentiviral transductions performed at different times. D Volcano plot summarizing knockout phenotypes and statistical significance (determined by two-sided Mann-Whitney U test) for sgRNA targets in the pooled CRISPR KO screen. Each dot represents an sgRNA target. Significant hits are labeled in red, with a more negative phenotype score indicating a stronger growth defect. E Gene ontology (GO) analysis identified top terms significantly associated with identified growth defect hits. F Independent validation of significant hits. Stable KO organoid lines were generated individually by lentiviral transduction of single sgRNA with a BFP reporter. 20,000 BFP-positive single cells were sorted and plated in 40 μL Matrigel domes. Brightfield images were taken for organoid growth on day 12.
Fig. 2
Fig. 2. Establishment of inducible CRISPR activation (iCRISPRa) and CRISPR inhibition (iCRISPRi) in human organoids.
A Schematic of the generation of stable iCRISPRi and iCRISPRa organoid lines. A rtTA-expressing TP53/APC DKO human gastric organoid line was first generated by lentiviral transduction, followed by secondary lentiviral transduction of iCRISPRi or iCRISPRa cassettes. After doxycycline induction, the rtTA-doxycycline complex can bind the TRE3G promoter and thus drive the expression of dCas9 fusion proteins and mCherry reporters. The mCherry-positive cell population was sorted to establish stable iCRISPRi and iCRISPRa human gastric organoid lines. B Brightfield and Immunofluorescence images suggested that dCas9-expressing iCRISPRi TP53/APC DKO human gastric organoids (mCherry-positive) were morphologically well-organized after doxycycline induction. C Western immunoblotting time course analysis of doxycycline induction of dCas9-KARB or dCas9-VPR fusion proteins. D iCRISPRi-sgCXCR4 and iCRISPRa-sgCXCR4 stable organoid lines were established by lentiviral transduction of an sgRNA-BFP construct that targets endogenous CXCR4 promoter regions. CXCR4-positive cells were quantified by antibody staining and flow cytometry 7 days post-doxycycline induction. E Western immunoblotting analysis demonstrated genetic knockdown (iCRISPRi) or overexpression (iCRISPRa) of SOX2 protein using two different sgRNAs, sgSOX2#1 and sgSOX2#2.
Fig. 3
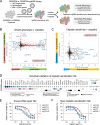
Fig. 3. Large-scale iCRISPRi and iCRISPRa screens in human organoids reveal gene-drug dependencies.
A Schematic of iCRISPRi and iCRISPRa screening strategies. Two new customized CRISPRi and CRISPRa sgRNA libraries that targeted an identical group of 1952 genes (~13,000 guides) were delivered into iCRISPRi and iCRISPRa stable organoids, respectively. Organoids were assigned into two groups - vehicle and cisplatin treatment - after sgRNA library delivery. The frequencies of cells expressing a given sgRNA were determined by next-generation sequencing, and the phenotype scores were quantified with the depicted formula. All screens were conducted as two completely independent experiments, involving separate lentiviral transductions performed at different times. B Summary of cell growth phenotypes (determined by screen score, see details in “Methods”) for sgRNA targets in the pooled iCRISPRi (x-axis) and iCRISPRa screens (y-axis). Each dot represents an sgRNA target. Significant hits were labeled in red, with either a cell defect or a growth advantage phenotype. C Cisplatin-associated gene-drug interactions were identified. Each dot represents a targeted gene. Gene hits were labeled in red, with either a cisplatin sensitivity or a cisplatin persistence phenotype. D A total of 41 significant top-scoring sgRNAs of the CRISPR cisplatin sensitivity screen were listed. Several top hits function as well-established DNA repair genes, and potential DNA damage sensors and mediators were identified as indicated. The dot color indicates the P-value (-log10), and the dot size indicates the screen score (log2). Two-sided Mann-Whitney test. E Independent validation of significant cisplatin sensitization hits, including ERCC6, ERCC4, and GTF2H5 in TP53/APC DKO iCRISPRi organoids. Stable knockdown organoid lines and control organoids that contain non-targeting sgRNAs were generated individually by lentiviral transduction of a single sgRNA. Fully titrated cisplatin treatment was performed to determine cisplatin sensitivity. Error bars represent the SEM of three independent experiments. F Identification of new cisplatin sensitization hits, including ELOF1, LEO1, and ZNF677. Stable knockdown organoid lines were established, followed by fully titrated cisplatin treatment. Error bars represent the SEM of three independent experiments.
Fig. 4
Fig. 4. Multiplexed single-cell iCRISPRi and iCRISPRa screens in human organoids.
A Schematic of the Perturb-seq platform in iCRISPRi and iCRISPRa organoids. The droplet-based single-cell RNA-sequencing (scRNA-seq) profiles each individual cell transcriptome with the expressed sgRNAs. B Timeline of Perturb-seq screens. dCas9 fusion proteins were induced by doxycycline 2 days before lentiviral transduction of the Perturb-seq sgRNA library. Six days after sgRNA delivery, organoids were treated by cisplatin or vehicle for 24 h, followed by 10X Genomics scRNA-seq. C The heatmap depicted the clustering of sgRNAs in the multiplexed iCRISPRi and iCRISPRa single-cell CRISPR screening experiments. Gene expression was derived by averaging all single cells that express the same sgRNA for transcript signatures of individual sgRNAs. The color bar represents signed log10(FDR). FDR false discovery rate. D UMAP plot of perturbation subpopulations with sgRNA targets MYC, SAMD4B, HHEX, MXI1, and ZBTB7A from the iCRISPRa experiment in (C). Control cells contain non-targeting control sgRNA. Each dot represents a single cell. E Cell cycle composition of subpopulations from (D). The heatmap indicated changes in cell numbers (percentage, %) in different cell cycle stages. F Bubble chart of gene set enrichment analysis (GSEA) indicated significant changes in gene sets of individual perturbation subpopulations, compared with control cells. NES normalized enrichment score.
Fig. 5
Fig. 5. High-dimensional single-cell transcriptomes reveal synergistic effects of gene-drug interactions.
A The cisplatin-naïve organoids in the single-cell iCRISPRi screen revealed heterogeneity upon individual genetic knockdown. For transcript signatures of individual sgRNAs, gene expression was derived by averaging all single cells that express the same sgRNA. B In cisplatin-treated organoids, inhibition of individual genes in the NER or HRR pathways resulted in highly convergent signatures governed by biological pathways. Such clustering was not observed in (A). C Example single-cell profiling of ERCC4 sgRNA-cisplatin gene-drug interactions. The columns represent heatmap expression of the 50 most synergistically regulated mRNAs from the ERCC4 sgRNA-cisplatin combination. Depicted are the average transcriptional profiles for the single perturbations (condition 1—cisplatin alone, condition 2—sgERCC4 alone) and the theoretically predicted gene expressions (condition 3—additive model). The actual measured expression is shown in condition 4—actual model. D Synergistic repression of fucosylated proteins by combining ERCC4 knockdown and 2 µg/ml cisplatin treatment for 48 h. Total fucosylated proteins were determined by AAL Western blotting. E Cisplatin treatment inhibited GMDS expression. GMDS mRNA levels were measured by qPCR. Relative fold change values are shown. Data points represent three technical replicates from one representative experiment out of two independently performed experiments. GMDS expression was detected by Western immunoblotting. Organoids were treated with 2 μg/mL cisplatin for 72 h. The samples derive from the same experiment, but different gels for the tested antibodies and GAPDH were processed in parallel. F Stable GMDS-overexpressing organoid lines were established by lentiviral transduction. GMDS mRNA levels were measured by qPCR. Relative fold change values are shown. Data points represent three technical replicates from one representative experiment out of two independently performed experiments. GMDS overexpression and total fucosylated proteins were detected by Western immunoblotting. The samples derive from the same experiment, but different gels for the tested antibodies and GAPDH were processed in parallel. G Constitutive expression of GMDS sensitized the cisplatin sensitivity of organoids. A fully titrated cisplatin treatment was performed in three independent experiments (N = 3) to determine cisplatin sensitivity. Error bars represent the SEM. H Quantification of γH2AX immunofluorescence staining in nuclei. Each dot represents a single nucleus. Data points represent one representative experiment out of two independently performed experiments. The red horizontal bar represents the mean value. Organoids were treated with 2 μg/mL cisplatin for 48 h.
Fig. 6
Fig. 6. TAF6L expression affects cisplatin sensitivity by regulating cell proliferation.
A Real-time PCR analysis of complementary DNAs synthesized from mRNA isolated from iCRISPRi TP53/APC DKO organoids carrying either sgControl (Ctrl) or sgTAF6L (KD) 5 days post-induction. Relative fold change is shown from three technical replicates. Data points represent one representative experiment out of two independently performed experiments. B Cell viability of Control (Ctrl) or TAF6L knockdown (KD) iCRISPRi TP53/APC DKO organoids after 3 days of cisplatin treatment. TAF6L (KD) showed a trend of increased sensitivity to cisplatin. Relative cell viability is shown from three technical replicates. Data points represent one representative experiment out of two independently performed experiments. C Western immunoblotting analysis demonstrated TAF6L expression in control (Ctrl), TAF6L knockdown (KD), and TAF6L-GFP overexpression (OE) organoids. D Cell viability of Control (Ctrl) or TAF6L-GFP overexpression (OE) TP53/APC DKO organoids after 3 days of cisplatin treatment. TAF6L-GFP OE showed a trend of decreased sensitivity to cisplatin. Relative cell viability is shown from three technical replicates per condition. Data points represent one representative experiment out of two independently performed experiments. E EdU assay indicated the EdU+ cell population (percentage, %) in parental control, TAF6L KD, TAF6L-GFP OE, and TAF6L-GFP re-expression in TAF6L KD organoids, with or without cisplatin treatment. EdU+ cells were quantified using flow cytometry. Cells were treated with 2 µg/ml cisplatin for 24 h. Quantification of three independent experiments was shown (N = 3). Two-sided T-test. *p < 0.01. F ATAC-seq analysis indicated significant differences in ATAC peaks between control and TAF6L KD organoids at the promoter regions. The pie chart shows the distribution of total differential ATAC peaks. G The pie chart shows the distribution of total differential ATAC peaks in control versus TAF6L-GFP OE organoids. H The lollipop plot shows the fold enrichment (obs/exp) of ATAC-seq peaks across annotated genomic regions in TAF6L KD and TAF6L OE conditions relative to the human reference genome (hg38). Differentially accessible peaks were classified into upregulated and downregulated groups for each condition.

References

    1. Sato, T. et al. Single Lgr5 stem cells build crypt-villus structures in vitro without a mesenchymal niche. Nature459, 262–265 (2009). - PubMed
    1. Ootani, A. et al. Sustained in vitro intestinal epithelial culture within a Wnt-dependent stem cell niche. Nat. Med.15, 701–706 (2009). - PMC - PubMed
    1. Lo, Y. H., Karlsson, K. & Kuo, C. J. Applications of organoids for cancer biology and precision medicine. Nat. Cancer1, 761–773 (2020). - PMC - PubMed
    1. Hahn, W. C. et al. An expanded universe of cancer targets. Cell184, 1142–1155 (2021). - PMC - PubMed
    1. Hsu, P. D., Lander, E. S. & Zhang, F. Development and applications of CRISPR-Cas9 for genome engineering. Cell157, 1262–1278 (2014). - PMC - PubMed

LinkOut - more resources