Review
. 2025 Aug 14;16(1):7382.
doi: 10.1038/s41467-025-62029-w.

A systemic risk assessment methodological framework for the global polycrisis

Affiliations
Review

A systemic risk assessment methodological framework for the global polycrisis

Ajay Gambhir et al. Nat Commun. .

Abstract

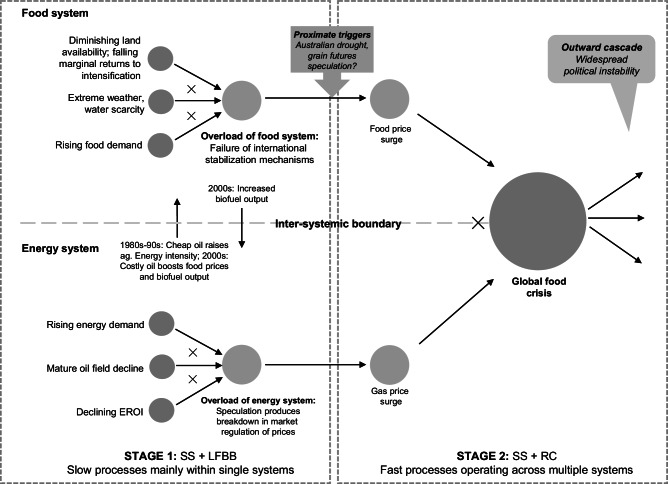
Human societies and ecological systems face increasingly severe risks, stemming from crossing planetary boundaries, worsening inequality, rising geo-political tensions, and new technologies. In an interconnected world, these risks can exacerbate each-other, creating systemic risks, which must be thoroughly assessed and responded to. Recent years have seen the emergence of analytical frameworks designed specifically for, or applicable to, systemic risk assessment, adding to the multitude of tools and models for analysing and simulating different systems. By assessing two recent global food and energy systemic crises, we propose a methodological framework applicable to assessing systemic risks in a polycrisis context, drawing from and building on existing approaches. Our framework's polycrisis-specific features include: exploring system architectures including their objectives and political economy; consideration of transformational responses away from risks; and cross-cutting practices including consideration of non-human life, trans-disciplinarity, and diversity, transparency and communication of uncertainty around data, evidence and methods.


Conflict of interest statement

Competing interests: The authors declare no competing interests.

Figures

Fig. 1
Fig. 1. The 2008 global food and energy crisis.
This figure depicts (on the left-hand side) long term simultaneous stresses (SS) which have built up over time. It also depicts long-fuse big bang (LFBB) processes, which represent the accumulation of stresses within systems until the systems’ coping capacity is exceeded (system overload), resulting in a sudden, non-linear shift in system behaviour. In the energy system, EROI is energy return on investment, which is the ratio of the energy output from an energy resource to the energy input to obtain that output. The figure shows how long-term stresses in food and energy systems have led to the overload of these systems. It also depicts the interaction between these systems (through the transmission channels of energy input into food prices and of biofuel output from cropland into energy systems) that effectively coupled these systems together. The food system, in its overloaded state, was susceptible to the trigger of the Australian drought, depicted in the middle of the figure, leading to a food price surge. As depicted on the right-hand side of the figure, this food price surge was compounded by a gas price surge from the overloaded energy system, exacerbating the resultant global food crisis. This crisis in turn had multisystemic knock-on effects (in a ramifying cascade—RC), including widespread political instability. The ‘X’ symbol depicts compounding stresses (on the left-hand side) and crises (on the right-hand side). Adapted from: Homer-Dixon et al.. Synchronous failure: the emerging causal architecture of global crisis. Ecology and Society, 20(3). https://www.ecologyandsociety.org/vol20/iss3/art6/—licensed under CC BY 4.0.
Fig. 2
Fig. 2. The 2022 global food and energy crisis.
This figure is based on, but further develops, the elements introduced in Fig. 1. As before, the left-hand side depicts long-term stresses. Note that these include specific post-COVID-19 recovery-related stresses additional to those depicted in Fig. 1. In particular it should be noted that the ‘rising energy demand’ element of Fig. 1 was exacerbated by a sharp increase in demand in the post-COVID-19 economic recovery, as depicted in this figure. Similarly, for the global food system, the post-COVID-19 recovery stretched supply chains, adding to the stresses on the food system from rising demand, diminishing land availability and diminishing marginal returns to intensification as depicted in Fig. 1. Rather than a ‘Long-fuse big bang’ system overload as depicted in Fig. 1, this figure shows the trigger of the Russia invasion of Ukraine leading to the materialisation of both an energy and food crisis, stemming from these already stressed, interconnected systems. It also depicts new elements, specifically the underlying political economy context, including concentrations of political and economic power and reliance on a few providers of food and energy commodities, as well as other underlying systemic weaknesses. In food systems, these weaknesses include geographical concentration of production in breadbasket regions, as well as homogenised crop production. In energy systems, these weaknesses include reliance on relatively price-volatile fossil fuel resources. Together these political economy contexts give rise to what we term system architecture vulnerabilities, which make it more likely that intra- and inter-systemic risks and crises will compound and cascade. As with Fig. 1, the ‘X’ symbol depicts compounding stressors (on the left-hand side) and crises (on the right-hand side). Produced by authors.
Fig. 3
Fig. 3. Catalogue of food and energy systems analysis approaches.
This figure shows a range of analytical approaches and models, with specific examples given for food and energy systems, ranging from mental models which are not formalised into structured relationships between variables, to mathematical, computer system models which do represent such structured formalisation. Intermediate stages (qualitative narratives, conceptual models and accounting models and tools) represent an increasing extent of formalisation and mathematical structure. Grey-scale differentiation is added only to distinguish categories of analytical approach and has no inherent implication. Each of these analytical approaches can be incorporated into the systemic frameworks in Table 1. It should be noted that mental models can encompass very different boundaries of systems, depending on the question and scale of analysis. Full details in Supplementary Data 1. Produced by authors.
Fig. 4
Fig. 4. A generalisable systemic risk assessment methodological framework.
The figure depicts (left-hand side) seven systemic risk assessment steps and (right-hand side) seven cross-cutting practices to be applied across each of the assessment steps. The steps are intended to be undertaken in the logical order shown, but the arrows indicate that that each step can and should if necessary, be returned to once other steps have been undertaken. As such, the framework is not prescriptive in its sequencing of steps. The arrow (left-hand side) from the ‘implement, monitor, evaluate and adapt’ step to the other steps is indicative that, once systemic risk assessments and responses have been implemented, they can and should, where necessary, lead to review and revision of each of the other steps. Produced by authors.

References

    1. Tooze, A. Welcome to the world of the polycrisis. https://www.ft.com/content/498398e7-11b1-494b-9cd3-6d669dc3de33 (2022).
    1. IPCC. Summary for policymakers. In Climate Change 2022: Impacts, Adaptation and Vulnerability. Contribution of Working Group II to the Sixth Assessment Report of the Intergovernmental Panel on Climate Change (eds Pörtner, H.-O. et al.) 1–34 10.1017/9781009325844.001 (Cambridge University Press, 2022).
    1. Richardson, K. et al. Earth beyond six of nine planetary boundaries. Sci. Adv.9, eadh2458 (2023). - PMC - PubMed
    1. Ceballos, G. & Ehrlich, P. R. Mutilation of the tree of life via mass extinction of animal genera. Proc. Natl Acad. Sci. USA120, e2306987120 (2023). - PMC - PubMed
    1. United Nations Department of Economic and Social Affairs. World Social Report 2020: Inequality in a Rapidly Changing World. 1–216 World-Social-Report2020-FullReport.pdf (un.org) (United Nations, 2020).

LinkOut - more resources