Molecular marker discovery and detection for blinding eye disease
- PMID: 40813679
- PMCID: PMC12351879
- DOI: 10.1186/s12951-025-03627-0
Molecular marker discovery and detection for blinding eye disease
Abstract
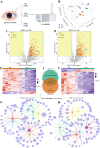
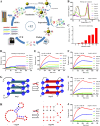
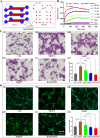
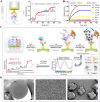
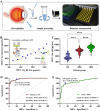
Accurate, sensitive, and specific detection of molecular markers in intraocular fluid will facilitate the early discovery, diagnosis, and intervention of eye diseases. In this study, a total of 168 participants were recruited and divided into two distinct cohorts: discovery and verification. In the discovery phase, proteomic analysis identified MCP-1 in aqueous humor as a potential molecular marker for blinding eye disease. We further developed a molecular detection technology for the marker based on biolayer interference sensing. The technology utilizes a sandwich strategy with one-to-one pairing of two different biorecognition molecules for MCP-1. It also incorporates automation, high throughput, and real-time monitoring, achieving highly selective recognition and accurate analysis of MCP-1. It demonstrates a low detection limit (0.16 pM), good reliability (R2 = 0.995), and a wide analytical range (0.244-1000 pM) for MCP-1 in human aqueous humor samples. Crucially, in the verification phase with 150 subjects, the technology achieved a high detection rate (95.0%) for patients with age-related macular degeneration and high myopia cataract in under 30 min, and was able to further differentiate between them with a specificity of 86.0%. Therefore, the developed molecular detection technology may provide a robust, convenient, and valuable solution for widespread screening, early discovery, and differential diagnosis of blinding eye diseases.
Keywords: Biorecognition molecules; Blinding eye diseases; Molecular detection technology; Molecular markers.
© 2025. The Author(s).
Conflict of interest statement
Declarations. Ethics approval and consent to participate: This study has been approved by the Ethics Committee of the Eye and ENT Hospital of Fudan University (2020[2020013]) and Shanghai General Hospital of Shanghai Jiao Tong University School of Medicine (2024HS237). All samples were collected with informed consent obtained from all subjects. Consent for publication: Not applicable. Competing interests: The authors declare no competing interests.
Figures


Similar articles
-
Blue-light filtering intraocular lenses (IOLs) for protecting macular health.Cochrane Database Syst Rev. 2018 May 22;5(5):CD011977. doi: 10.1002/14651858.CD011977.pub2. Cochrane Database Syst Rev. 2018. PMID: 29786830 Free PMC article.
-
Responsiveness of anti-VEGF treatment for polypoidal choroidal vasculopathy based on aqueous humour proteomics: A preliminary study.Acta Ophthalmol. 2025 Mar;103(2):e136-e145. doi: 10.1111/aos.16768. Epub 2024 Oct 18. Acta Ophthalmol. 2025. PMID: 39420792
-
Comparative analysis of human tear fluid and aqueous humor proteomes.Ocul Surf. 2024 Jul;33:16-22. doi: 10.1016/j.jtos.2024.03.011. Epub 2024 Mar 30. Ocul Surf. 2024. PMID: 38561100 Free PMC article.
-
Systemic pharmacological treatments for chronic plaque psoriasis: a network meta-analysis.Cochrane Database Syst Rev. 2021 Apr 19;4(4):CD011535. doi: 10.1002/14651858.CD011535.pub4. Cochrane Database Syst Rev. 2021. Update in: Cochrane Database Syst Rev. 2022 May 23;5:CD011535. doi: 10.1002/14651858.CD011535.pub5. PMID: 33871055 Free PMC article. Updated.
-
Positron emission tomography-adapted therapy for first-line treatment in individuals with Hodgkin lymphoma.Cochrane Database Syst Rev. 2015 Jan 9;1(1):CD010533. doi: 10.1002/14651858.CD010533.pub2. Cochrane Database Syst Rev. 2015. Update in: Cochrane Database Syst Rev. 2025 Mar 26;3:CD010533. doi: 10.1002/14651858.CD010533.pub3. PMID: 25572491 Free PMC article. Updated.
References
-
- Ha A, Kim SH, Kang GE, Yoon HJ, Kim YK. Association between sight-threatening eye diseases and death by suicide in South Korea a nationwide population-based cohort study. Ophthalmology. 2023;130:804–11. - PubMed
-
- Kai JY, Zhou M, Li DL, Zhu KY, Wu Q, Zhang XF, Pan CW. Smoking, dietary factors and major age-related eye disorders: an umbrella review of systematic reviews and meta-analyses. Br J Ophthalmol. 2023;108:51–7. - PubMed
-
- Liu S, Lv D, Sun J, Jia H, Zheng F, Pereira F, Narendran S, Dong Z, Liu H, Gao S, Huang P. Recent advancements in the treatment of Age-Related macular degeneration. Med Res. 2025;00:1–19. 10.1002/mdr2.70009.
-
- Blindness GBD, Vision Impairment C, Vision Loss Expert Group of the Global Burden of Disease. Trends in prevalence of blindness and distance and near vision impairment over 30 years: an analysis for the global burden of disease study. Lancet Glob Health. 2021;9:e130–43.
MeSH terms
Substances
LinkOut - more resources
Full Text Sources
Medical
Miscellaneous

