. 2025 Oct;31(10):3394-3403.
doi: 10.1038/s41591-025-03888-0. Epub 2025 Aug 14.

A personal health large language model for sleep and fitness coaching

Affiliations

A personal health large language model for sleep and fitness coaching

Justin Khasentino et al. Nat Med. 2025 Oct.

Abstract

Although large language models (LLMs) show promise for clinical healthcare applications, their utility for personalized health monitoring using wearable device data remains underexplored. Here we introduce the Personal Health Large Language Model (PH-LLM), designed for applications in sleep and fitness. PH-LLM is a version of the Gemini LLM that was finetuned for text understanding and reasoning when applied to aggregated daily-resolution numerical sensor data. We created three benchmark datasets to assess multiple complementary aspects of sleep and fitness: expert domain knowledge, generation of personalized insights and recommendations and prediction of self-reported sleep quality from longitudinal data. PH-LLM achieved scores that exceeded a sample of human experts on multiple-choice examinations in sleep medicine (79% versus 76%) and fitness (88% versus 71%). In a comprehensive evaluation involving 857 real-world case studies, PH-LLM performed similarly to human experts for fitness-related tasks and improved over the base Gemini model in providing personalized sleep insights. Finally, PH-LLM effectively predicted self-reported sleep quality using a multimodal encoding of wearable sensor data, further demonstrating its ability to effectively contextualize wearable modalities. This work highlights the potential of LLMs to revolutionize personal health monitoring via tailored insights and predictions from wearable data and provides datasets, rubrics and benchmark performance to further accelerate personal health-related LLM research.


Conflict of interest statement

Competing interests: This study was funded by Google LLC. All authors are employees of Alphabet and may own stock as part of the standard compensation package.

Figures

Fig. 1
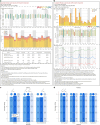
Fig. 1. Schematic and performance of PH-LLM.
a, Schematic showing the overall experiment design of the study. PH-LLM was evaluated on three aspects of personal health: (1) assessing its level of expert knowledge based on certification examination-style MCQs; (2) generating personalized insights and recommendations for user goals in the sleep and fitness domains; and (3) predicting PROs for sleep quality from aggregated daily-resolution numerical sensor data. b, Performance of PH-LLM, as contextualized with the responses of human experts, for professional examinations, coaching recommendations and PROs for sleep quality. Data are presented as mean accuracy (n = 629 sleep questions and n = 99 fitness examination questions), mean human expert rating (n = 4,265 sleep and n = 5,049 fitness case study ratings across principles and subsections from PH-LLM and n = 2,606 and n = 3,335 from human experts) and AUROC (n = 833 survey responses) bootstrapped over 1,000, 1,000 and 100 iterations, respectively. Error bars represent 95% confidence intervals. ‘*’ indicates a statistically significant difference between two groups using a two-sided t-test for examinations (P = 1.52 × 10−10 for fitness) and a two-sided Wilcoxon rank-sum test for recommendation ratings (P = 3.31 × 10−11 for sleep). ‘Naive performance’ is that achieved by a random classifier HR, heart rate; HRV, heart rate variability.
Fig. 2
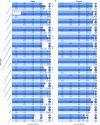
Fig. 2. Long-form case study evaluation and performance.
a,b, Visual depiction of wearable sensor data used as input and corresponding expert analysis and recommendations for improving sleep quality (a) and for assessing workout readiness and fitness (b). For each case study, the experts considered demographic information and wearable sensor data for a period of up to 30 days over which the device was worn (sections (i)–(iii) of a and b). For all metrics considered, see Supplementary Tables 26 and 27 for sleep data and Supplementary Tables 28–36 for fitness data. Both human experts and PH-LLM used these inputs to create domain-specific responses: sleep case studies contained subsections for insights, possible etiologies and recommendations, and fitness case studies contained subsections for training load, sleep, health metrics, readiness assessment and recommendations. Abridged examples of human expert responses are shown in sections (iv) of a and b. c,d, Mean expert ratings across all subsection principles for case study responses generated by Gemini Ultra 1.0, PH-LLM and human experts in the sleep (c) and fitness (d) domains. Error bars represent 95% confidence intervals bootstrapped over 1,000 iterations. ‘*’ indicates a statistically significant difference (P < 0.05) between two response types using the two-sided Wilcoxon rank-sum test and multiple hypothesis testing correction. Within each bar, n denotes the number of principle ratings per conversation source, and circles show the proportion of scores at a given Likert rating. bpm, beats per minute; brpm, breaths per minute; hh, hours; HR, heart rate; HRV RMSSD, heart rate variability root mean square of successive differences; mm, minutes. Source data
Fig. 3
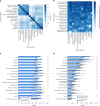
Fig. 3. Prediction of PROs by PH-LLM.
a, Correlations among survey responses for questions that measure related but distinct sleep outcomes from the PROMIS Sleep Disturbance and Sleep Impairment surveys. b, Feature importance for sensor features predicting survey responses in a linear regression model. The top two predictors for each survey question, measured based on the magnitude of the regression coefficient, are annotated with ‘*’. c, AUROC for the performance of PH-LLM with adapter, zero-shot and few-shot prompting approaches when predicting binary outcomes derived from survey responses in the test set (n = 833). The dashed vertical line denotes the AUROC of the random predictor. Data are presented as mean AUROC over 100 bootstrapping iterations, and error bars show 95% confidence intervals. Outcomes for which the confidence intervals of the difference in AUROC between PH-LLM with adapter and both zero- and few-shot both exclude 0 in 100 paired bootstrapping iterations are annotated with ‘*’. d, AUPRC for the performance of PH-LLM with adapter, zero-shot and few-shot prompting approaches when predicting binary outcomes derived from survey responses in the test set (n = 833). Outcome-specific prevalence bars are added to show the AUPRC of the random predictor. Survey response names are mapped to their corresponding questions in Supplementary Tables 39 and 40. SI, sleep impairment. Data are presented as mean AUPRC over 100 bootstrapping iterations, and error bars show 95% confidence intervals. Outcomes for which the confidence intervals of the difference in AUPRC between PH-LLM with adapter and both zero-shot and few-shot both exclude 0 in 100 paired bootstrapping iterations are annotated with ‘*’. Source data
Extended Data Fig. 1
Extended Data Fig. 1. Case study creation and curation, model training, and response evaluation workflow.
a, Case studies were selected from anonymized Fitbit production data from individuals who provided consent for research purposes. Two sets of case studies were generated: one set for model training, validation, and testing and a separate holdout set for final evaluation. To facilitate rapid development of high-quality answers, the train/validation/test set of case studies had candidate responses generated by Gemini, which were then edited and rewritten by domain experts. To enable comparison of human and model-derived responses, the holdout set had responses written solely by the domain experts. b, For model training, each case study was split into multiple prompt/answer pairs based on how many sections the case study had: N=3 for sleep with insights, etiology, and recommendations sections, N=5 for fitness with demographics, training load, sleep metrics, health metrics, and assessment sections (Methods). Gemini Ultra 1.0 underwent full fine-tuning using those examples to create PH-LLM. c, Expert evaluation was performed independently on the holdout dataset by the same set of domain experts responsible for generating the expert responses. For each case study in the holdout set, one or more experts who did not write the corresponding expert response graded the candidate responses (expert-written response, Gemini Ultra 1.0 response, and PH-LLM response, with 94 of the 100 case studies having all three candidate responses graded by a single expert.
Extended Data Fig. 2
Extended Data Fig. 2. Overall performance on sleep and fitness professional exams across PH-LLM, other Gemini models, GPT models, Claude 3 Opus, and Med-PaLM 2.
All Gemini model sizes are based on the Gemini 1.0 model family. The sleep and fitness exams comprised n= 629 and n= 99 questions, respectively. Data are presented as mean categorical accuracy over 1,000 bootstrapping iterations and error bars show 95% confidence intervals. Source data
Extended Data Fig. 3
Extended Data Fig. 3. Pairwise Gwet’s AC2 measuring inter-rater reliability between primary and secondary raters.
Metrics were computed using all ratings for each principle and section across case studies rated by more than one rater in the sleep (a) and fitness (b) domains. The number of overlapping ratings is denoted by n. Mean metrics and 95% confidence intervals derived from 1,000 bootstrapping iterations are reported for each pair. Source data
Extended Data Fig. 4
Extended Data Fig. 4. Contingency tables showing pairwise rating agreement between raters.
Counts are aggregated across all case studies, sections, and principles for each case study for which multiple ratings are available in the sleep (a) and fitness (b) domains. Blue, primary versus primary raters. Green, primary versus secondary raters. Yellow, secondary versus secondary raters. Source data
Extended Data Fig. 5
Extended Data Fig. 5. Sleep and fitness case study human evaluation results by principle.
Mean ratings given by experts for different case study evaluation principles across all sections in the sleep (a) and fitness (b) domains. The principles are ordered according to the rubric presented in Supplementary Table 9. ‘*’ indicates a statistically significant difference (p < 0.05) using the two-sided Wilcoxon rank-sum test and multiple hypothesis testing correction. Error bars represent 95% confidence intervals bootstrapped over 1,000 iterations. Within each bar, n denotes the number of principle ratings per conversation source and circles show the proportion of scores at a given Likert rating. Source data
Extended Data Fig. 6
Extended Data Fig. 6. Contingency tables showing pairwise rating agreement between our best AutoRaters, their corresponding expert raters, and other experts.
Counts are aggregated across all case studies, sections, and principles for each case study for which at least one rating from the AutoEval training rater is available in the sleep (a) and fitness (b) domains. Blue, the primary expert rater versus other raters. Green, the AutoEval model trained on primary expert ratings versus other raters. Yellow, the primary expert rater versus the corresponding AutoEval model. Source data
Extended Data Fig. 7
Extended Data Fig. 7. Automatic evaluation of coaching recommendations across PH-LLM, baseline models, and human experts.
Mean ratings were generated using our best AutoEval models for the holdout case study subsections in the sleep (a) and fitness (b) domains. Within each section, a ‘*’ indicates a statistically significant difference (p <0.05) from the top rated response type using the two-sided Wilcoxon rank-sum test and multiple hypothesis testing correction. Error bars represent 95% confidence intervals bootstrapped over 1,000 iterations. Within each bar, n denotes the number of principle ratings per conversation source and circles show the proportion of scores at a given Likert rating. Source data
Extended Data Fig. 8
Extended Data Fig. 8. Effect of fine-tuning data scale on model performance in coaching recommendations.
Mean ratings were generated using our best AutoEval models for the holdout case study subsections in the sleep (a) and fitness (b) domains. ‘PH-LLM’ denotes standard performance while ‘Subsampled 25%’ and ‘Subsampled 50%’ denote responses from models trained on 25% and 50% of the training dataset, respectively. ‘Gemini Ultra’ denotes untuned baseline performance (that is, Gemini Ultra 1.0 trained on 0% of the training dataset). Within each section, a ‘*’ indicates a statistically significant difference (p <0.05) from the top rated response type using the two-sided Wilcoxon rank-sum test and multiple hypothesis testing correction. Error bars represent 95% confidence intervals bootstrapped over 1,000 iterations. Within each bar, n denotes the number of principle ratings per conversation source and circles show the proportion of scores at a given Likert rating. Source data
Extended Data Fig. 9
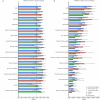
Extended Data Fig. 9. Performance of PH-LLM and traditional ML models on patient-reported outcomes prediction.
We compared the ability of PH-LLM with and without a multimodal adapter, logistic regression, and a convolutional neural network (CNN) to infer subjective patient-reported outcomes in the test set (n=833). a, Area under the receiver operating characteristic curve (AUROC). b, Area under the precision-recall curve (AUPRC). Data are presented as mean performance measures over 100 bootstrapping iterations and error bars show 95% confidence intervals. The CNN underperforms logistic regression, likely due to the limited size of the dataset. Source data
Extended Data Fig. 10
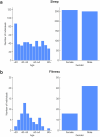
Extended Data Fig. 10. Distributions of age and gender in case studies.
a, Sleep (N=507 individuals). b, Fitness (N=58 individuals). Source data

References

    1. Katz, D. M., Bommarito, M. J., Gao, S. & Arredondo, P. GPT-4 passes the bar exam. Philos. Trans. A Math. Phys. Sci. Eng.382, 20230254 (2024). - PMC - PubMed
    1. Singhal, K. et al. Toward expert-level medical question answering with large language models. Nat. Med.31, 943–950 (2025). - PMC - PubMed
    1. Nori, H. et al. Can generalist foundation models outcompete special-purpose tuning? Case study in medicine. Preprint at https://arxiv.org/abs/2311.16452 (2023).
    1. Saab, K. et al. Capabilities of Gemini models in medicine. Preprint at https://arxiv.org/abs/2404.18416 (2024).
    1. McDuff, D. et al. Towards accurate differential diagnosis with large language models. Nature642, 451–457 (2025). - PMC - PubMed