. 2025 Aug 14;16(1):7567.
doi: 10.1038/s41467-025-62599-9.

Multimodal spatial transcriptomic characterization of mouse kidney injury and repair

Affiliations

Multimodal spatial transcriptomic characterization of mouse kidney injury and repair

Qiao Xuanyuan et al. Nat Commun. .

Abstract

The transition from acute kidney injury to chronic kidney disease is characterized by significant changes in the cellular composition and molecular interactions within the kidney. Utilizing high-resolution Xenium and whole transcriptome Visium spatial transcriptomics platforms, we analyze over a million cells on 12 male mouse kidneys across six stages of renal injury and repair. We define and validate 20 major kidney cell populations and delineate distinct cellular neighborhoods through this multimodal spatial analysis. We further reveal a specific fibro-inflammatory niche enriched in failed-repair proximal tubule cells, fibroblasts, and immune cells, with conserved neighborhood gene signatures across mouse and human. Within this niche, we predict Runx2 as a key upstream regulator, along with platelet-derived growth factor and integrin beta-2 signaling pathways shaping the fibrogenic microenvironment. Altogether, our study provides deep insights into the cellular and molecular dynamics during kidney injury and repair and establishes a comprehensive multimodal analytical framework applicable to other spatial omics studies.


Conflict of interest statement

Competing interests: The authors declare no competing interests.

Figures
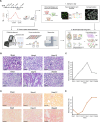
Fig. 1
Fig. 1. Experimental design.
A Mouse kidney samples were collected at various time points (hour 4, hour 12, day 2, day 14, and week 6) after bilateral ischemia-reperfusion injury (BIRI). N = 1 mice per group. The measurement of blood urea nitrogen (BUN) levels confirmed the acute injury to the kidneys. Kidneys were preserved as formalin-fixed, paraffin-embedded (FFPE) tissue blocks. Serial sections of 6 μm thickness obtained from FFPE blocks were mounted onto slides for spatial transcriptomics analysis. The experimental workflow comprises three main steps: (1) Xenium in situ profiling with a customized 300-gene panel was performed on one section, followed by post-Xenium Periodic Acid Schiff (PAS) staining. (2) An adjacent section was stained with hematoxylin and eosin (H&E) and transferred to the Visium CytAssist platform for whole-transcriptome profiling. (3) A shared coordinate system was established for aligning morphology images and molecular data from both platforms. Morphology images were aligned to their respective cell/spot point data. (Created in BioRender. Humphreys, B. (https://BioRender.com/blvpfyn). B Representative post-Xenium PAS staining images across IRI time points. Scale bar: 40 μm. C Quantified tubular lesion scores. D Representative Sirius Red staining images. Scale bar: 40 μm. E Quantified interstitial fibrosis scores.
Fig. 2
Fig. 2. Spatiotemporal profiling of cellular dynamics during acute kidney injury and repair in mice.
A Spatiotemporal distribution of cell types within selected kidney regions, spanning from control (Sham) through AKI progression and repair time course. For each time point, cellular composition from cortex to medulla are visualized. Pod, podocytes; Glom-EC, glomerulus endothelial; PTS1, S1 segment of proximal tubule; PTS2, S2 segment of proximal tubule; PTS3, S3 segment of proximal tubule; Inj-PT, injured proximal tubule; FR-PT, failed repair proximal tubule; DTL, descending limb of loop of Henle; TAL, thick ascending limb of loop of Henle; DCT, distal convoluted tubule; CNT, connecting tubule; PC, principal cells; ICA, type A intercalated cells; ICB, type B intercalated cells; Uro, urothelium; PEC, parietal epithelial cells; EC, endothelial cells; Fib, fibroblasts; Per-SMC, pericytes and smooth muscle cells. B Heatmap displaying representative differentially expressed genes across major cell populations. C UMAP projection of major cell types identified using Xenium platform. D Representative PAS images of major cell types with corresponding marker gene expression patterns in spatial context. Scale bar: 50 μm.
Fig. 3
Fig. 3. Spatiotemporal mapping of PT cell state transitions.
A UMAP displaying PT cell subpopulations in Xenium. B Temporal composition of PT cell states. C Marker gene expression of identified PT cell states. D Sankey diagram displaying the transition between PT cell states across consecutive time points. PCA embedding visualized PT cell at day 2, with cells predicted to transition to different states by day 14 represented in distinct colors. E Violin plot showing marker genes of PT with different cell fates.
Fig. 4
Fig. 4. Dynamic distribution of cellular neighborhoods.
A Enrichment score of cell types across different cell neighborhoods, with values reflecting relative abundance (positive score) or scarcity (negative score) of that cell type. B Ridgeline plot visualizing cell neighborhood abundance across IRI time points. C Spatiotemporal maps of cell neighborhoods distribution over the IRI time course. The regions are the same as in Fig. 2A. D Colocalization between cell types across IRI time points. Node size represents the number of cells for each cell type and edge width represents the colocalization z-score. E Spatial co-localization analysis of selected two cell types. Line plots show the average percentage of the neighboring target cell type associated with the central cell type (indicated in brackets) as a function of neighborhood radius. Shaded area indicates 95% confidence intervals.
Fig. 5
Fig. 5. Functional characterization of identified cell neighborhoods using Visium dataset.
A Visualization of spatial gene expression patterns for selected marker genes using Xenium and Visium technologies, overlaid on post-Xenium PAS images. Scale bar: 100 μm. The red arrows highlight kidney glomeruli in the histological images. The corresponding PAS image is available in Supplementary Fig. 8E. B Scatter plot comparing gene expression between Visium spots and mapped pseudo-Visium spots from Xenium data. Overlapped 295 genes are shown. The color gradient represents the correlation coefficient between the two technologies. The inset panel highlights the correlation for the Acsm3 gene. C Schematic workflow of Xenium-Visium integration and cell neighborhood label transfer. D Heatmap of Jaccard index of top 20 marker gene similarity between corresponding neighborhood clusters from Xenium and Visium datasets. Higher values indicating greater overlap in gene expression profiles. E Dotplot showing top differentially expressed genes and top deconvoluted cell types across cell neighborhoods using Visium whole transcriptomic data. F Pathway enrichment analysis of differentially expressed gene sets from injured proximal tubule niche (CN4) and fibro-inflammatory niche (CN7). P values were calculated using Fisher’s exact test with Benjamini-Hochberg false discovery rate correction for multiple comparisons. G Transcription factor activities were inferred using DecoupleR with univariate linear model. Top predicted transcription factors were visualized as graph networks (FDR-adjusted p-value < 1e-20, Log2FC > 0.7). H Immunostaining for RUNX2, α-SMA and VCAM1 on day 14 post-BIRI sample. RUNX2 is localized in the nuclei of α-SMA+ fibroblasts. Scale bar: 20 μm.
Fig. 6
Fig. 6. Cell-cell communication dynamics.
A Significantly enriched ligand-receptor interactions among FR-PT cells, injured PT cells, fibroblast and immune cells. B Immunofluorescent staining visualized the close proximity between VCAM1 + FR-PT cells, F4/80+ macrophages and PDGFRα+ fibroblasts. C Immunofluorescent staining of ICAM1 and ITGβ2. I. F4/80+ macrophages within peritubular space on abluminal side of tubular basement membrane marked by COL4α1/2. II. ICAM1 expression in VCAM1 + LTL tubules after bilateral IRI. III. ITGβ2 + F4/80+ macrophage neighbor VCAM1+ tubules in injured kidneys. IV. Orthogonal views of a longitudinally sectioned VCAM1+ tubule and two ITGβ2 + F4/80+ macrophage. Yellow arrowhead denotes a macrophage. White arrowheads denote macrophage extensions. Scale bar = 10 μm (I, II, III) and 100 μm (IV). D, E Predicted spatial signaling directions and the amount of sender and receiver signals for the PDGF and ITGβ2 signaling pathways in the kidney. The zoom-out figure shows the spatial distribution of cell types from Xenium data. Scale bar = 100 μm F, G Heatmap of differentially expressed genes associated with PDGF and ITGβ2 pathways. H Bar plots of top enriched signaling pathways in the fibro-inflammatory niche (CN7). Wilcoxon rank-sum test, P values adjusted using Benjamini-Hochberg. I Enriched signaling activity across Visium cell neighborhoods. CN0: Loop of Henle; CN1: Glomerular Niche; CN2: Cortical Proximal Tubule; CN3: Medullary Proximal Tubule; CN4: Injured Proximal Tubule; CN5: Collecting Duct Niche; CN6: Distal Tubule Niche; CN7: Fibro-inflammatory Niche; CN8: Uro-immune Niche.

References

    1. Bellomo, R., Kellum, J. A. & Ronco, C. Acute kidney injury. Lancet380, 756–766 (2012). - PubMed
    1. Wang, H. E., Muntner, P., Chertow, G. M. & Warnock, D. G. Acute kidney injury and mortality in hospitalized patients. Am. J. Nephrol.35, 349–355 (2012). - PMC - PubMed
    1. Jager, K. J. et al. A single number for advocacy and communication—worldwide more than 850 million individuals have kidney diseases. Nephrol. Dial. Transpl.34, 1803–1805 (2019). - PubMed
    1. Ferenbach, D. A. & Bonventre, J. V. Mechanisms of maladaptive repair after AKI leading to accelerated kidney ageing and CKD. Nat. Rev. Nephrol.11, 264–276 (2015). - PMC - PubMed
    1. Kumar, S. Cellular and molecular pathways of renal repair after acute kidney injury. Kidney Int93, 27–40 (2018). - PubMed

MeSH terms

LinkOut - more resources