Review
. 2025 Aug 14;44(1):240.
doi: 10.1186/s13046-025-03495-4.

TRP channels and cancer modulation: a voyage beyond metabolic reprogramming, oxidative stress and the advent of nanotechnologies in targeted therapy

Affiliations
Review

TRP channels and cancer modulation: a voyage beyond metabolic reprogramming, oxidative stress and the advent of nanotechnologies in targeted therapy

Marialaura Giannaccari et al. J Exp Clin Cancer Res. .

Abstract

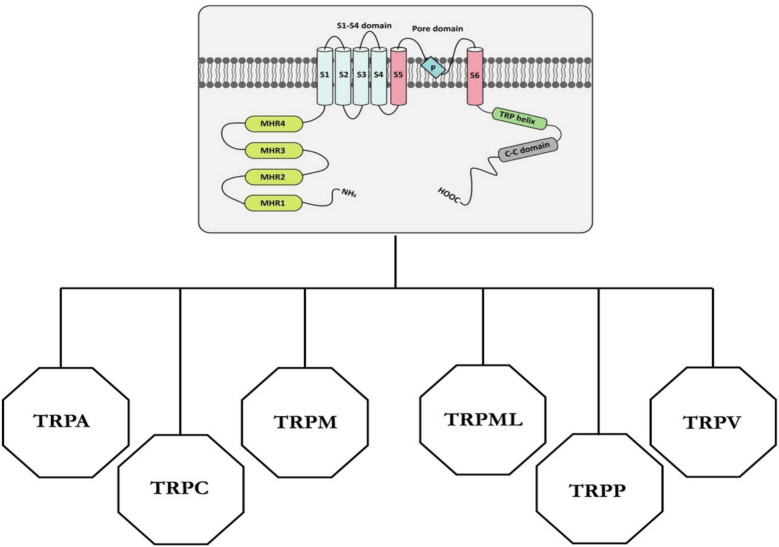
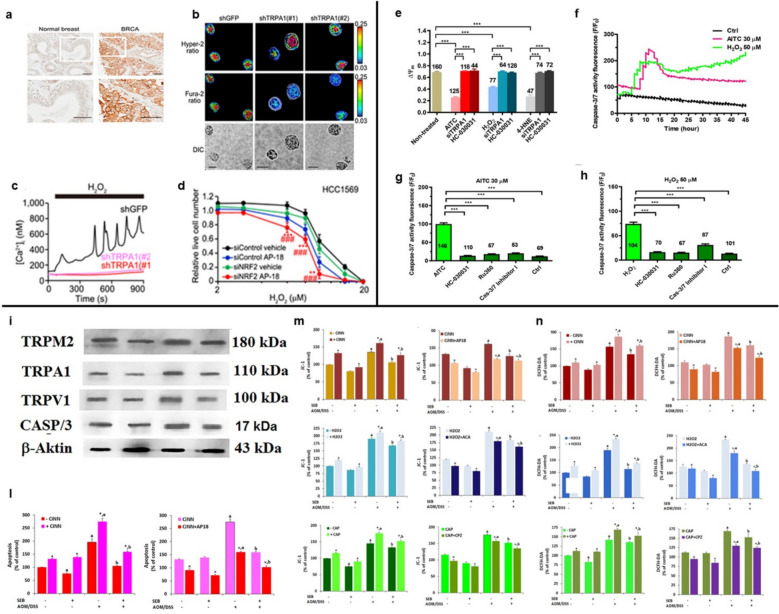
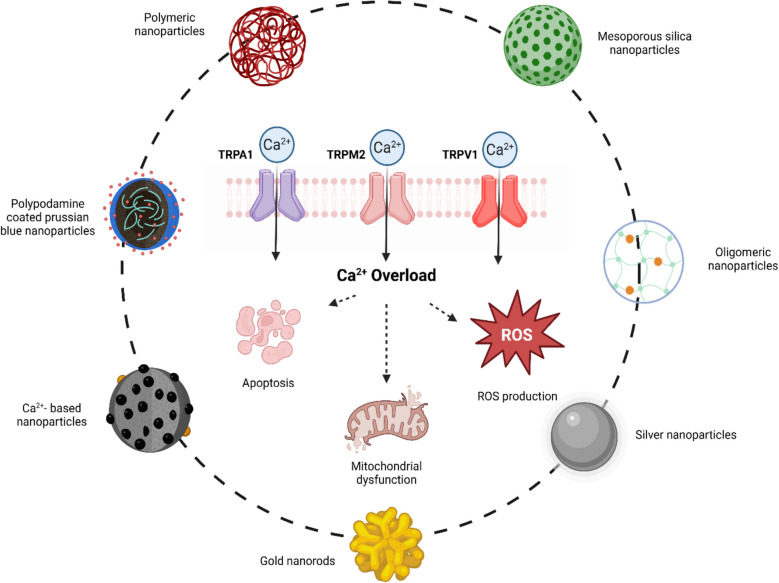
Transient receptor potential (TRP) channels are a large family of non-selective cation channels that play critical roles in cellular homeostasis and signal transduction. Recent investigations have clearly highlighted their involvement in cancer biology, particularly in the regulation of cancer metabolism. Unlike normal cells, cancer cells tend to favour the energy inefficient glycolytic pathway over the more effective oxidative phosphorylation process. TRP channels are involved in critical steps of cancer-related metabolic reprogramming by influencing intracellular Ca2+ signaling. Their dysregulation can intensify oxidative stress, thereby promoting oncogenic transformation and tumor progression. The intricate interplay between TRP channels, metabolic reprogramming and oxidative stress promotes cancer cell progression and resistance to treatment. This review highlights the crucial role of TRP channels in tumorigenesis. It examines how TRPM7 and TRPM8 contribute to metabolic reprogramming by its involvement in glycolysis pathway. Additionally, it explores the involvement of TRPML1, TRPA1, TRPM2, and TRPV1 in modulating reactive oxygen species (ROS) levels within cancer cells, analyzing the ROS dual role in tumor modulation. The advent of nanotechnology, particularly through the utilisation of engineered nanoparticles, has facilitated the selective modulation of TRPA1, TRPM2, and TRPV1 channels. This technological breakthrough has paved the way for novel and more targeted anticancer treatment strategies. The integration of molecular insights with cutting-edge technological approaches holds great promise for the development of more effective and targeted cancer treatments.

Keywords: Cancer; Metabolic reprogramming; Nanotechnologies; Oxidative stress; TRP channels.


Conflict of interest statement

Declarations. Ethics approval and consent to participate: Not required for this study. Consent for publication: Not applicable. Competing interests: The authors declare no competing interests.

Figures

Fig. 1
Fig. 1
Schematic overview of TRP channel families. TRP channels are composed of six transmembrane segments (S1–S6), featuring a pore-forming loop between the S5 and S6 segments. Both the N- and C-termini are located intracellularly [22]. The cytoplasmic end of the S6 helix forms the lower gate, which controls the opening and closing of the channel to regulate cation flow. The S1–S4 segments may act as gating domains in response to ligand binding; however, the relatively low number of positively charged arginine residues in the S4 helix suggests limited voltage sensitivity of TRP channels. Regions outside the S5–S6 domain mediate interactions between subunits within the channel complex [23]. Based on structural homology, the 28 known TRP channel subunits are classified into six families: TRPA (ankyrin), TRPML (mucolipin), TRPM (melastatin), TRPC (classical or canonical), TRPV (vanilloid), and TRPP (polycystin) [23]. [Adapted from reference 23, Creative Commons Attribution 4.0]
Fig. 2
Fig. 2
TRPM7 role in metabolic reprogramming in bladder (a-f) and ovarian cancer (g-o). a RT-qPCR analysis of different TRP channels, data were normalized on β-actin (ACTB). The results revealed that TRPM7 was the most expressed. b Investigation of the hallmark gene sets in TRPM7KO versus WT T24 cells using gene set enrichment analysis (GSEA). c Extracellular acidification rates (ECAR) were used to quantify glycolysis in WT and TRPM7KO cells in both basal and response conditions to 10 mM glucose, 3 μM oligomycin, or 100 mM 2-deoxy-D-glucose (2-DG). Relative lactate within the cell in either TRPM7KO or WT cells. d RT-qPCR analysis confirming the reduced expression levels of glucose catabolic genes from RNA-seq in TRPM7KO cells. e TRPM7, SLC2A3, and DAPI immunofluorescence labelling in the xenograft tumor (scale bars, 100 μm). f TRPM7, SLC2A1, and SLC2A3 immunohistochemical staining of tumor tissue (size bars, 100 μm) [from a to f, Creative Commons Attribution 4.0 International License; [11]]. g IHC study of the expression of TRPM7, HK2, PDK1, IDH3B, and UQCRC1 in human ovarian cancer and non-tumor tissues. The scale bar,50 μm. h–i WB and RT-qPCR evaluations of the expression of HK2, PDK1, IDH3B, and UQCRC1 in SKOV3 and HO8910 cell lines. l-m Evaluating glucose uptake, lactic acid generation, and ECAR in SKOV3-sh-control, SKOV3-sh-TRPM7, HO8910-sh-control, and HO8910-sh-TRPM7 cells with or without treatment with Compound C (CC) or metformin. n-o Western blot of AMPK phosphorylation, IDH3B, UQCRC1, HIF-1α, HK2, and PDK1 expression in the indicated cell groups [from g to o, Creative Commons Attribution 4.0 International License [12]]
Fig. 3
Fig. 3
Role of TRPM7 (a-f) and TRPM8 (g-o) in metabolic reprogramming in Hepatocellular carcinoma. a The upregulation of TRPM7 expression in hypoxic HCC cell lines. In six HCC lines, 1% O2 treatment resulted in an increase in TRPM7 mRNA expression across a 24-h period. *, p < 0.05. b mRNA expression of HIF-1α and HIF-2α in SK-hep1 and HepG2 cells transfected with siRNA targeting HIF-1α or HIF-2α. c-d qPCR, Western blot and ATP detection of PGM1, PGM2, PGM3, and PFKL in Huh-7 cell line. *p < 0.05. e–f TRPM7 accelerated the growth of HCC. Overexpression of TRPM7 in Huh7 cells promotes the rate of wound healing (e) and tumor growth in nude mice (f) *, p < 0.05 [from a to f, Copyright:xxx [98]]. g TRPM8 was examined through qPCR in 20 samples of human HCC tissues. P tissue from tumors, T tissue from tumors. *p < 0.05, **p < 0.01, ***p < 0.001. h TRPM8 immunohistochemistry staining in 78 more human tissues. Bar scale: 50 µm. i-l TRPM8 was detected by Western blotting and qPCR in five HCC cell lines and the normal liver cell line L02. The data were expressed as the mean ± SEM. m TEM representative images. Red arrows indicate nucleoli, green arrows mitochondria, and yellow arrows chromatin. n qPCR was used to determine the expression level of SNORA55 in HCC and peritumor tissues. *p < 0.05, **p < 0.01, ***p < 0.001. o Western blotting was utilized to determine the presence of cleaved-caspase 9, Cyt C, and BAX after cytoplasmic and mitochondrial proteins were extracted. Internal controls included β-Actin in the cytoplasm and VDAC1 in the mitochondria [from g to o, Copyright:xxx [102]
Fig. 4
Fig. 4
Involvement of TRPML1 in metastatic melanoma (a-f) and TRPA1 in glioblastoma cells (g-n) in cancer process mediated by oxidative stress. a An illustration of human tissue sections immunostained with an anti-ML1 antibody (brown DAB staining) from normal skin, nevus (benign tumor), and metastatic melanoma. 200 μm scale bar. b The effects of SA5 and SA8 on the dose-dependent viability of M12, MeWo, and normal melanocytes were assessed 24 h post-drug treatment using the CellTiter-Glo ATP assay. c Real-time imaging of MitoTracker-stained normal melanocytes (left panels, 60 min), MeWo (middle panels, 60 min), and M12 (right panels, 30 min) cells following treatment with DMSO (Ctrl) or SA5 (3 μM). Scale bar measures 10 μm. d PI-staining was performed on Ctrl or siML1-transfected MeWo and M12 cells with SA5 (3 μM) for a duration of 3 to 6 h. The composite images of phase contrast and PI are presented. The scale bar,25 μm. e Mitochondria in representative transmission electron microscopy (TEM) pictures of M12 cells treated for 30 min with either DMSO (Ctrl) or SA5 (3 μM). 200 nm is the scale bar. f A statistical study was conducted on the size of the mitochondria in control cells and SA5-treated cells **p < 0.01. [from a to f, CC BY-NC-ND license [15]]. g-h Apoptosis rate in response to TMZ and a TRPA1 agonist and inhibitor. In U251 and SHG44 cell lines, cotreatment with PF-4840154 and TMZ enhanced the activity of caspase-3 and caspase-9 as well as the protein expression of cleaved caspase-3. The impact of TMZ and a TRPA1 agonist inhibitor on intracellular Ca2⁺ concentrations in U251 cells was investigated using western blot analysis to measure the levels of Bcl-2 protein, BAX protein, and MGMT protein following TMZ or drug treatment in U251 cells. i-l In U251 cells and SHG-44 cells, cotreatment with TMZ and PF-4840154 raised the intracellular Ca2+ levels *p < 0.05. m–n Impact of TMZ and an agonist and inhibitor of TRPA1 on the expression of mitochondrial fission and fusion proteins. OPA1, MFN2, and DRP levels in SHG-44 and U251 cells following TMZ and a TRPA1 agonist and inhibitor therapy are analyzed through Western blot. GAPDH served as the internal reference [from g to n, Creative Commons Attribution 4.0 International License [127]
Fig. 5
Fig. 5
Involvement of TRPA1 in breast (panels a–d) and colorectal cancer (panels e–h), as well as the roles of TRPA1, TRPM2, and TRPV1 in colitis-associated cancer (panels i–n), during tumor progression driven by oxidative stress. a Immunocytochemical staining showing TRPA1 expression in normal versus breast tumor tissues. Scale bar = 50 μm. b Calcium influx response triggered by 10 μM H₂O₂ in HCC1569 cells. ***p < 0.001. c Representative images of Hyper-2 and fura-2 fluorescence ratio in day-5 HCC1569 spheroids transduced with either shTRPA1 or shGFP. Scale bar = 50 μm. d Relative live cell counts of HCC159 cells following a 72-h exposure to H₂O₂ with or without 10 μM AP-18. Data represent means ± SD from three independent experiments performed in duplicates. *p < 0.05, **p < 0.01, ***p < 0.001 compared to siControl cells treated with AP-18; ###p < 0.001 compared to siNRF2 cells with vehicle treatment [panels a–d, Copyright: xxx [128]]. e Mean ± SE measurements of mitochondrial membrane potential (∆Ψm) under control and various treatment conditions. ***p < 0.001. f Changes in CellEvent™ fluorescence indicating caspase-3/7 activity in control and after treatment with AITC (30 µM) or H₂O₂ (50 µM). g Quantification of CellEvent™ fluorescence intensity under the following conditions: Control; AITC (30 µM, 6 h); AITC + HC-030031 (30 µM, 30 min); AITC + Ru360 (5 µM, 30 min); AITC + Caspase-3/7 Inhibitor I (20 µM, 30 min). ***p < 0.001. h Quantitative analysis of CellEvent™ fluorescence intensity after treatment with: Control; H₂O₂ (50 µM, 6 h); H₂O₂ + HC-030031; H₂O₂ + Ru360; H₂O₂ + Caspase-3/7 Inhibitor I. ***p < 0.001 [panels e–h, Creative Commons Attribution 4.0 International License [129]]. i In a mouse model of AOM/DSS-induced tumors, administration of Sambucus ebulus L (SEB, 100 mg/kg/day) led to decreased expression of TRP channels and caspase-3 (CASP/3), with β-actin as loading control. l Colonic tissues from mice with colorectal cancer exhibited reduced apoptosis triggered by TRPA1 stimulation; treatment with the TRPA1 agonist (CiNN) enhanced apoptosis, whereas the antagonist reduced it. *p ≤ 0.05. m TRP agonist treatments elevated mitochondrial membrane potential (miPOT) in colon cells of AOM/DSS-induced colorectal cancer mice, with SEB modulating this effect (mean ± SD, n = 3). *p ≤ 0.05. n TRP agonists also increased cytosolic reactive oxygen species (cyROS) production in colon cells from the same model; SEB administration mitigated this increase (mean ± SD, n = 3). In the AOM/DSS group, cyROS levels were significantly elevated, while SEB treatment reduced these levels. *p ≤ 0.05 [panels i–n, Copyright: xxx [130]]
Fig. 6
Fig. 6
Biomedical Applications of Nanomodulators for [Ca2+]i Regulation. Several nanomaterials have been applied to modulate intracellular calcium levels by activating reactive oxygen species (ROS)-sensitive TRP channels, including TRPA1, TRPM2, and TRPV1. Upon stimulation, [Ca2+]i levels rise, leading to apoptosis

Similar articles

References

    1. Sabit H, Arneth B, Abdel-Ghany S, Madyan EF, Ghaleb AH, Selvaraj P, et al. Beyond Cancer Cells: How the Tumor Microenvironment Drives Cancer Progression. Cells. 2024;13:1666. - PMC - PubMed
    1. Siegel RL, Kratzer TB, Giaquinto AN, Sung H, Jemal A. Cancer statistics, 2025. CA Cancer J Clin. 2025;75:10–45. - PMC - PubMed
    1. Zou J, Wang E. Cancer biomarker discovery for precision medicine: new progress. Curr Med Chem. 2020;26:7655–71. - PubMed
    1. Yue, Lixia, and Haoxing Xu. “TRP channels in health and disease at a glance.” J Cell Sci. 2021;134(13):jcs258372. 10.1242/jcs.258372. - PMC - PubMed
    1. Marini M, Titiz M, de Souza Monteiro A, Geppetti P, Nassini R, De Logu F. TRP Channels in Cancer: Signaling Mechanisms and Translational Approaches. Biomolecules. 2023;13:1557. - PMC - PubMed

LinkOut - more resources