

N-glycans in lung tissue specimens: a prospective target for enhanced cancer diagnosis and prognosis
- PMID: 40813986
- PMCID: PMC12355761
- DOI: 10.1186/s12967-025-06904-6
N-glycans in lung tissue specimens: a prospective target for enhanced cancer diagnosis and prognosis
Abstract
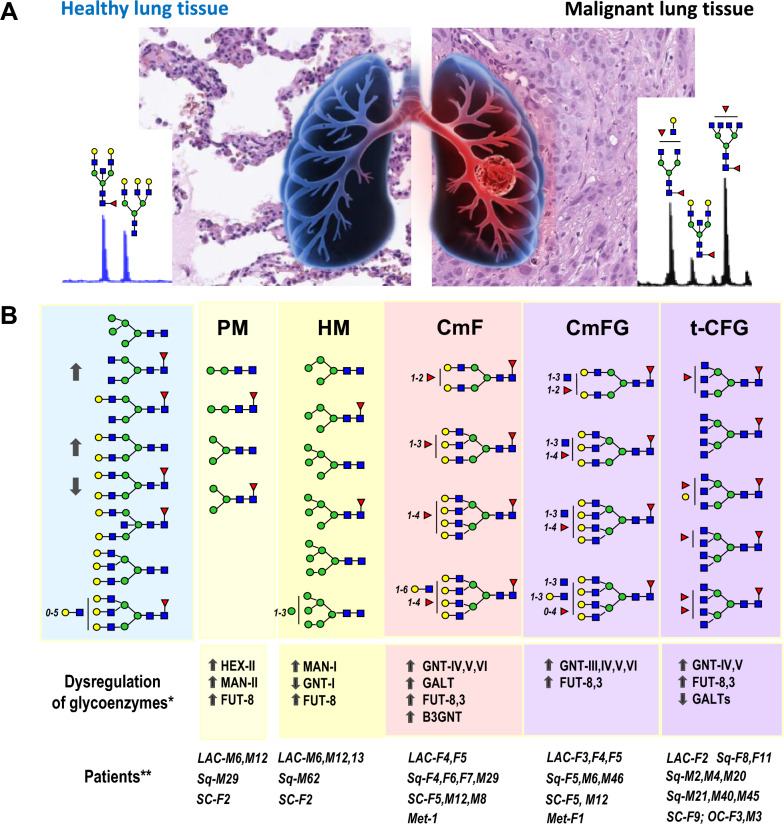
Background: It is well established that the cancerous transformation of cells is accompanied by profound alterations in glycosylation. In this study, we demonstrate the diagnostic potential of N-glycan profiling in tissue specimens from patients, primarily representing the two major types of lung cancer: non-small cell and small cell lung cancer.
Methods: Lung tissues and biopsies obtained from surgery and bronchoscopy underwent sample processing and enzymatic digestion. After labeling, glycans were analyzed employing matrix-assisted laser desorption/ionization mass spectrometry. Statistical analysis was conducted using methods following principles of compositional data analysis.
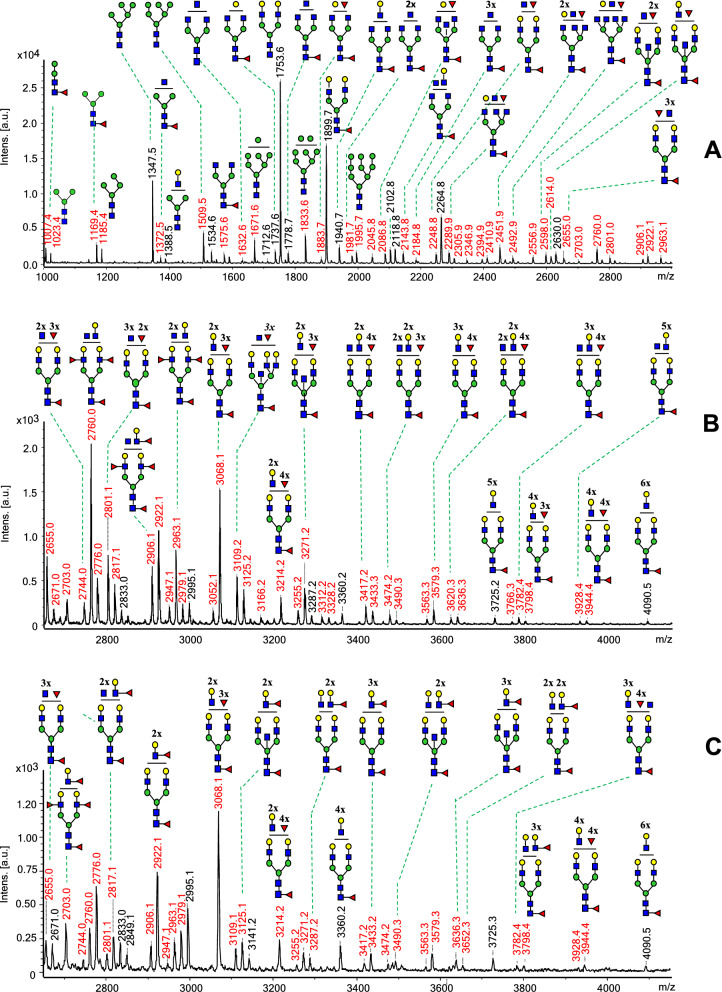
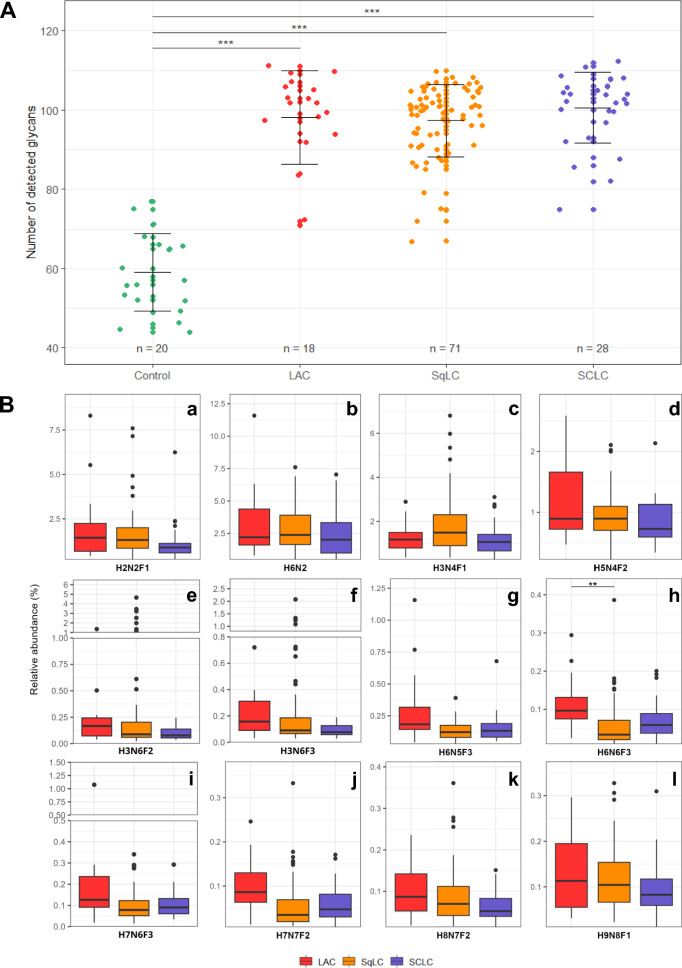
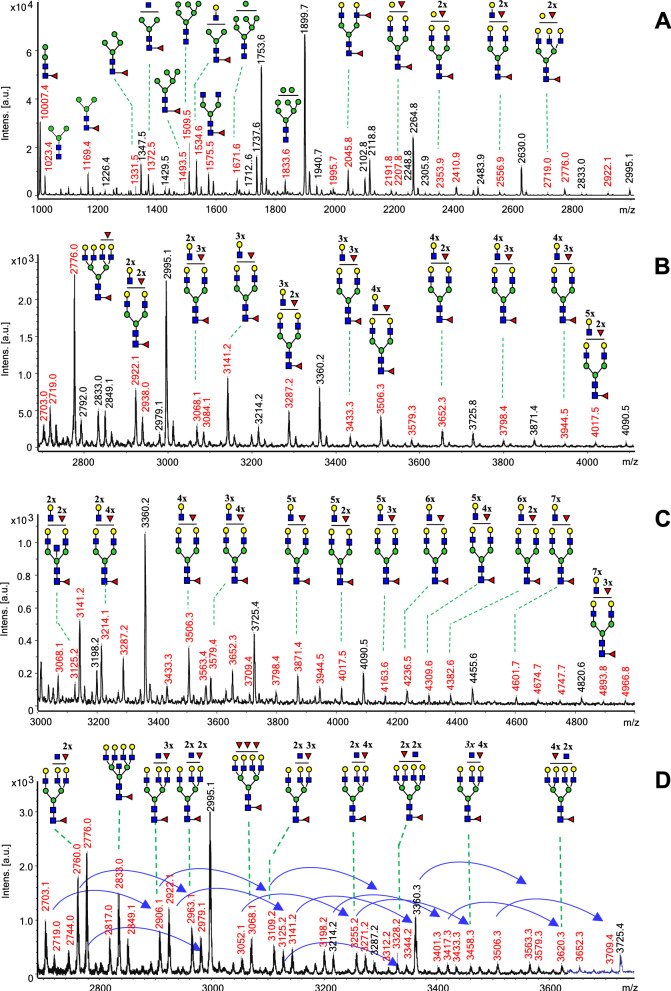
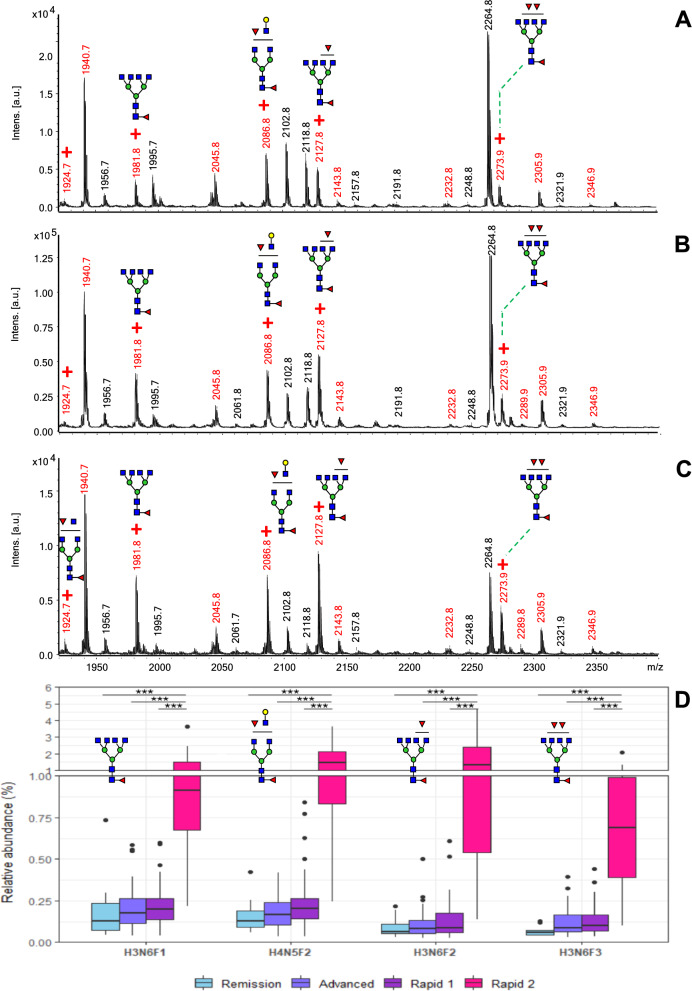
Results: Comparison of glycan profiles demonstrated an increase in paucimannose and high mannose glycans in most tumor specimens, including those with inflammation and histological negative for malignancy. Cancerous tissues exhibited more profound changes in glycosylation. Despite the high heterogeneity in profiles, two main groups of not detected glycans in peritumoral tissues, considered as controls, were observed to correlate with cancer progression in patients. One with complex polylactosamine multifucosylated glycans frequently harboring terminal N-acetyl-glucosamine residues. These glycans were present in most tumors, with their numbers and intensities increasing as cancer progressed. In contrast, the second group exhibited polylactosamine glycans sporadically. Instead, the biopsies of several patients with rapid progression displayed a significant presence in a set of tri- and tetra-antennary core fucosylated glycans having mostly unoccupied N-acetyl-glucosamine residues unless carrying additional fucose unit(s).
Conclusions: The results imply distinct glycosylation patterns even in patients with the same histological type of lung cancer, supporting trends toward personalized diagnosis and more tailored therapies. Currently, tissue biopsies remain the gold standard for diagnosing premalignant and malignant lesions in the lung. Expanded knowledge on glycosylation in these lesions could contribute to improved diagnostic accuracy and better monitoring of malignant disease progression in clinical practice.
Keywords: N-glycans; Branched glycans; Fucosylation; Glycosylation; Lung cancer; MALDI-MS.
© 2025. The Author(s).
Conflict of interest statement
Declarations. Ethics approval and consent to participate: This study was performed in line with the principles of the Declaration of Helsinki. Approval was granted by the Ethics Committee of the University Hospital and Faculty of Medicine at Masaryk University in Brno, Czech Republic (reference number 23–120619/EK). All involved patients signed an informed consent approved by the regional Ethics Committee. Consent for publication: The authors read and approved the final version of the manuscript. Competing interests: The authors declare that they have no competing interests.
Figures
Similar articles
-
Prescription of Controlled Substances: Benefits and Risks.2025 Jul 6. In: StatPearls [Internet]. Treasure Island (FL): StatPearls Publishing; 2025 Jan–. 2025 Jul 6. In: StatPearls [Internet]. Treasure Island (FL): StatPearls Publishing; 2025 Jan–. PMID: 30726003 Free Books & Documents.
-
Can a Liquid Biopsy Detect Circulating Tumor DNA With Low-passage Whole-genome Sequencing in Patients With a Sarcoma? A Pilot Evaluation.Clin Orthop Relat Res. 2025 Jan 1;483(1):39-48. doi: 10.1097/CORR.0000000000003161. Epub 2024 Jun 21. Clin Orthop Relat Res. 2025. PMID: 38905450
-
Signs and symptoms to determine if a patient presenting in primary care or hospital outpatient settings has COVID-19.Cochrane Database Syst Rev. 2022 May 20;5(5):CD013665. doi: 10.1002/14651858.CD013665.pub3. Cochrane Database Syst Rev. 2022. PMID: 35593186 Free PMC article.
-
Comparison of Two Modern Survival Prediction Tools, SORG-MLA and METSSS, in Patients With Symptomatic Long-bone Metastases Who Underwent Local Treatment With Surgery Followed by Radiotherapy and With Radiotherapy Alone.Clin Orthop Relat Res. 2024 Dec 1;482(12):2193-2208. doi: 10.1097/CORR.0000000000003185. Epub 2024 Jul 23. Clin Orthop Relat Res. 2024. PMID: 39051924
-
Magnetic resonance perfusion for differentiating low-grade from high-grade gliomas at first presentation.Cochrane Database Syst Rev. 2018 Jan 22;1(1):CD011551. doi: 10.1002/14651858.CD011551.pub2. Cochrane Database Syst Rev. 2018. PMID: 29357120 Free PMC article.
References
-
- Sung H, Ferlay J, Siegel RL, Laversanne M, Soerjomataram I, Jemal A, et al. Global cancer statistics 2020: GLOBOCAN estimates of incidence and mortality worldwide for 36 cancers in 185 countries. Cancer J Clin. 2021;71:209–49. - PubMed
-
- Thai AA, Solomon BJ, Sequist LV, Gainor JF, Heist RS. Lung cancer. The Lancet. 2021;398:535–54. - PubMed
-
- Kirby T. Young non-smoker diagnosed with lung cancer. Lancet Respir Med. 2020;8:141–2. - PubMed
LinkOut - more resources
Full Text Sources
