. 2025 Jul 15;15(7):2949-2969.
doi: 10.62347/XSRQ4118. eCollection 2025.

Increased autophagy activity suppresses hyperglycemia-related colorectal cancer tumorigenesis both in vitro and in vivo

Affiliations

Increased autophagy activity suppresses hyperglycemia-related colorectal cancer tumorigenesis both in vitro and in vivo

Pei-Wen Lin et al. Am J Cancer Res. .

Abstract

Hyperglycemia contributes to recurrence, poor survival, and drug resistance in colorectal cancer (CRC) patients. Overexpression of G9a (euchromatic histone-lysine N-methyltransferase 2, EHMT2), together with decreased autophagy activity, has been implicated in promoting CRC tumorigenesis and chemoresistance. Here, we demonstrate that high glucose (25 mM) enhances proliferation, focus formation, and migration of CRC cells, while concurrently suppressing autophagy activity. Importantly, pharmacological induction of autophagy increases CRC cell sensitivity to chemotherapeutic agents (5-fluorouracil and oxaliplatin) and attenuates high glucose-induced tumorigenic behaviors. Analysis of CRC patient specimens and data from the TCGA COAD database revealed that LC3, an autophagy marker, is elevated in tumor tissues compared to adjacent normal tissues, and that high LC3 mRNA expression correlates with poor overall survival. Furthermore, enhancing autophagy via the autophagy inducer rapamycin significantly suppressed high glucose-induced tumor formation in a CRC xenograft mouse model. In addition, we identified niclosamide (NC), a repurposed antihelminthic agent, and its derivative niclosamide ethanolamine (NEN), as potential G9a inhibitors and autophagy inducers. NEN dose-dependently suppressed high glucose-activated oncogenic signaling pathways, including β-catenin, c-Myc, STAT3, G9a, and cyclin D1, while restoring autophagy activity. Collectively, our in vitro and in vivo findings strongly support that enhancing autophagy represents a multifaceted strategy to alleviate hyperglycemia, inhibit G9a-mediated signaling, increase chemosensitivity, and suppress high glucose-driven CRC tumorigenesis.

Keywords: Autophagy; colorectal cancer; hyperglycemia; niclosamide ethanolamine.


Conflict of interest statement

The authors declare that the research was conducted in the absence of any commercial or financial relationships that could be construed as a potential conflict of interest.

Figures
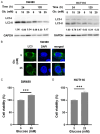
Figure 1
Figure 1
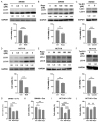
The effect of high glucose on the autophagy activity and cell viability of CRC cell lines. (A) SW480 and HCT116 cells were incubated in 5, 15, or 25 mM glucose (Glc) containing media for 1 day and 5 days. Cell lysates were investigated for LC3 protein level by Western blotting using the anti-LC3 antibody. GAPDH was used as the internal control. (B) LC3 protein was labeled by FITC-conjugated anti-LC3 antibody, and the nucleus was labeled by DAPI in SW480 cells maintained in 5 or 25 mM glucose medium for 1 day and investigated under a confocal fluorescent microscope. Scale bar =5 um. (C) SW480 cells and (D) HCT116 cells were incubated in 5 or 25 mM glucose-containing media for 72 h. Cell viability was determined by MTT assay at 570 nm wavelength. Error bars represent mean ± SD. Data were analyzed by Student’s t-test. ***: P<0.001.
Figure 2
Figure 2
The effect of enhancing autophagy activity on CRC cell viability and sensitivity to anti-cancer drugs under high glucose conditions. (A-C) SW480 cells and (D-F) HCT116 cells were maintained in high glucose media with different concentrations of autophagy inducers for 24 h. LC3 protein levels were determined by Western blotting using the specific anti-LC3 antibody. GAPDH was used as the internal control. Cells were further treated with 1 μM niclosamide ethanolamine salt (NEN; A, D), 150 nM rapamycin (Rapa; B, E), or 5 μM Tat-D11 (C) and (F) for 48 h followed by MTT assay to determine the cell viability. (G, H) SW480 cells and (I, J) HCT116 cells were treated with 150 nM rapamycin (Rapa) or 1 μM NEN combined with 1 μg/ml 5-fluorouracil (5-FU; G and I) or 7.5 μg/ml oxaliplatin (Oxa; H and J) for 48 h. Cell viability was determined by MTT assay. Error bars represent mean ± SD. Data were analyzed by Student’s t-test or one-way ANOVA. *: P<0.05; **: P<0.01; ***: P<0.001.
Figure 3
Figure 3
The effect of glucose concentration and autophagy activity on focus formation, migration, and sphere formation of CRC cells. A. SW480 cells were treated with 150 nM rapamycin (Rapa) or 1 μM niclosamide ethanolamine (NEN) under 5 or 25 mM glucose medium for 7 days to form foci. The representative images and quantified data of cell-formed foci under 5 mM (low glucose, LG) or 25 mM (high glucose, HG) glucose medium at 7 days were shown. B. To clarify the effect of glucose concentration and autophagy activity on the mobility of SW480 cells, the wound healing assay was conducted. SW480 cells were treated with 1 μM NEN or 150 nM Rapa for 24 h, and the cell migration under 5 or 25 mM glucose conditions were evaluated by the wound healing assay. Representative images of each group at the indicated time points after gap formation were shown. C. To clarify the effect of glucose concentration and autophagy activity on the stemness of SW480 cells, sphere formation assay was conducted. SW480 cells in 5 or 25 mM glucose medium was pretreated with 1 μM NEN or 150 nM Rapa for 24 h to observe sphere formation for 7 days. Quantification is shown in the diagram. Error bars represent mean ± SD. Data were analyzed using one-way ANOVA or two-way ANOVA. * P<0.05; **: P<0.01; ***: P<0.001.
Figure 4
Figure 4
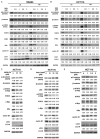
Signaling pathways involved in NEN treatment of CRC cells under low and high glucose conditions. (A) SW480 cells and (B) HCT116 cells maintained in 5 mM (low glucose, LG) or 25 mM (high glucose, HG) glucose medium were treated with various doses of NEN for 24 h. HCT116 cells were treated with (C) c-Myc inhibitor (10058-F4), (D) β-catenin inhibitor (PNU-74654), and (E) STAT3 inhibitor (Tanshinone C) at the indicated doses for 24 h. Protein levels of G9a, β-catenin, phospho-β-catenin (Ser675), p62, STAT3, phospho-STAT3 (Tyr705), c-Myc, cyclin D1, and LC3 were evaluated by Western blotting using specific antibodies. GAPDH was used as the internal control.
Figure 5
Figure 5
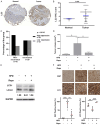
Analysis of the expression level of LC3 in clinical CRC specimens as well as the effect of high-fat diet and increased autophagy on tumor formation in xenograft mice. A. Representative images of LC3 expression in the tumor and the normal tissue of CRC specimens in the tissue array. B. Quantification of LC3 protein levels in non-tumor (n=59) and tumor (n=169) sections of CRC specimens. The level of LC3 expression was scored from 0 to +9 by a pathologist. A paired t-test was used to compare two groups. Error bars represent mean ± SD. Data were analyzed by Student’s t-test. ***: P<0.001. C. Percentage of high and low LC3 expression in non-recurrence (n=41) and recurrence (n=20) CRC specimens. High and low LC3 protein expression was defined by the mean IHC value of the tumor tissue. Data were analyzed using Fisher’s exact test. D. SW480 cells (2×10⁶) were inoculated subcutaneously into nude mice fed with HFD for 11 weeks. Three days after cancer cell inoculation, rapamycin (Rapa, 3 mg/kg) was intraperitoneally injected into the mice every 3 days for 21 days and sacrificed. The final tumor volume was determined. E. The protein expression level was evaluated by Western blotting using an anti-LC3 antibody. GAPDH was used as the internal control. F. Representative Ki67 and LC3 IHC staining images showed the protein expression levels in the tumor tissues. Magnification: 20×. The quantification was based on the average of 4 randomly selected fields. The values shown are expressed as the mean ± SD. Data were analyzed using one-way ANOVA. ns: no significant; *P<0.05; **P<0.01; ***P<0.001.
Figure 6
Figure 6
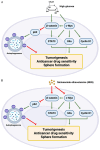
High glucose and NEN treatment related signaling pathways involved in CRC tumorigenesis. A. High glucose induces β-catenin - c-Myc - STAT3 - G9a - cyclin D1 signaling together with decreased autophagy. B. NEN decreases β-catenin - c-Myc - STAT3 - G9a - cyclin D1 axis accompanied by increased autophagy Green line: induction signaling; Red line: suppression signaling. These images were created in https://BioRender.com.

References

    1. Purandare NC, Dua SG, Arora A, Shah S, Rangarajan V. Colorectal cancer-patterns of locoregional recurrence and distant metastases as demonstrated by FDG PET/CT. Indian J Radiol Imaging. 2010;20:284–288. - PMC - PubMed
    1. Wang B, Wang S, Wang W, Liu E, Guo S, Zhao C, Niu J, Zhang Z. Hyperglycemia promotes liver metastasis of colorectal cancer via upregulation of integrin αvβ6. Med Sci Monit. 2021;27:e930921. - PMC - PubMed
    1. Xia B, He Q, Pan Y, Gao F, Liu A, Tang Y, Chong C, Teoh AYB, Li F, He Y, Zhang C, Yuan J. Metabolic syndrome and risk of pancreatic cancer: a population-based prospective cohort study. Int J Cancer. 2020;147:3384–3393. - PubMed
    1. Montemurro N, Perrini P, Rapone B. Clinical risk and overall survival in patients with diabetes mellitus, hyperglycemia and glioblastoma multiforme. A review of the current literature. Int J Environ Res Public Health. 2020;17:8501. - PMC - PubMed
    1. Yang IP, Miao ZF, Huang CW, Tsai HL, Yeh YS, Su WC, Chang TK, Chang SF, Wang JY. High blood sugar levels but not diabetes mellitus significantly enhance oxaliplatin chemoresistance in patients with stage III colorectal cancer receiving adjuvant FOLFOX6 chemotherapy. Ther Adv Med Oncol. 2019;11:1758835919866964. - PMC - PubMed

LinkOut - more resources