. 2025 Aug 1;152(15):dev204557.
doi: 10.1242/dev.204557. Epub 2025 Aug 15.

Cnot3 is required for male germ cell development and spermatogonial stem cell maintenance

Affiliations

Cnot3 is required for male germ cell development and spermatogonial stem cell maintenance

Qing Chen et al. Development. .

Abstract

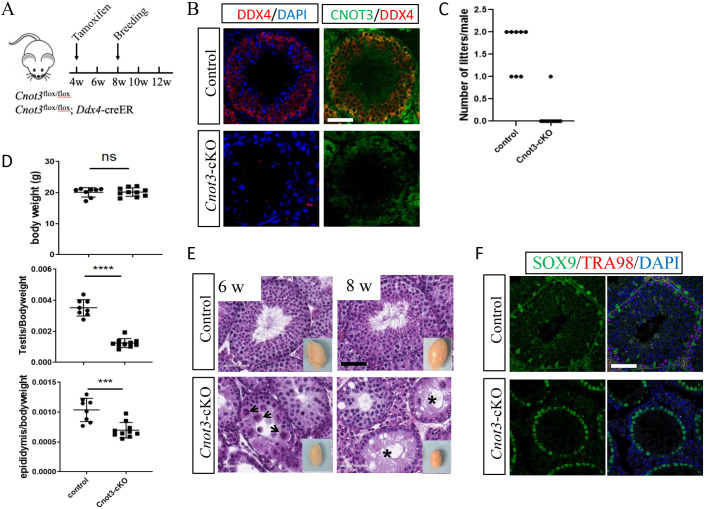
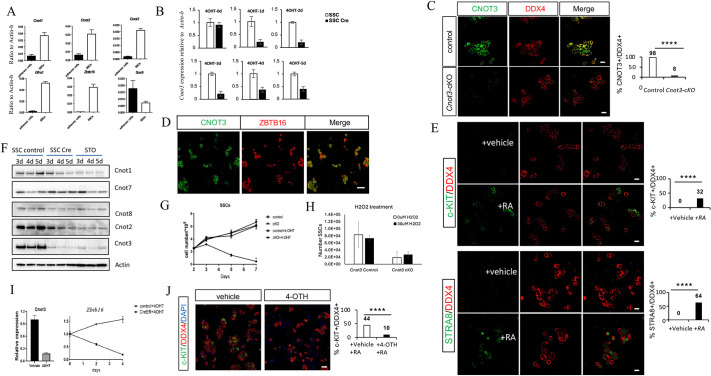
The foundation of spermatogenesis and lifelong fertility is provided by spermatogonial stem cells (SSCs). SSCs divide asymmetrically to either self-renew or produce undifferentiated progenitors. However, regulatory mechanisms governing SSC maintenance are poorly understood. Here, we show that the CCR4-NOT mRNA deadenylase complex subunit CNOT3 is essential for sustaining spermatogonial populations in mice. Its deletion in adult germ cells resulted in germ cell loss and infertility, and its deletion in spermatogonia in the developing testis resulted in SSC depletion and compromised spermatogenesis. Consistent with the in vivo results, deletion of Cnot3 in cultured SSCs caused a reduction in cell proliferation and viability, and downregulation of SSC markers. Mechanistically, Cnot3 deletion led to the de-repression of transcripts encoding factors involved in spermatogonial differentiation, including those in the glutathione redox pathway that are crucial for SSC maintenance. Together, our study reveals that CNOT3 - likely via the CCR4-NOT complex - promotes the degradation of transcripts encoding differentiation factors to maintain the SSCs in the stem cell state, highlighting the importance of CCR4-NOT-mediated post-transcriptional gene regulation in SSCs and male germ cell development.

Keywords: Glutathione redox pathway; Maintenance; Mouse; Spermatogenesis; Spermatogonial stem cells; scRNA-seq.


Conflict of interest statement

Competing interests The authors declare no competing or financial interests.

Figures

Fig. 1.
Fig. 1.
Cnot3 deletion results in germ cell loss and male infertility. (A) Schematic of conditional deletion of Cnot3 in male germ cell upon 4-OHT (tamoxifen) administration. (B) Merged channels of single confocal sections of 8-week-old control and Cnot3-cKO testis showing CNOT3 (green) and DDX4 (red) expression with DAPI (blue). (C) Quantification of live litters obtained from WT females mated with control and Cnot3-cKO males. n=8 for control; n=10 for Cnot3-cKO. (D) Quantification of body weight in grams, testis to body weight ratio and epididymis to body ratio weight ratio of 8-week-old control and Cnot3-cKO males. ***P<0.001, ****P<0.0001 (two-tailed, unpaired Student's t-test). ns, not significant (P>0.05). Data are mean±s.e.m. n=8 for control; n=10 for Cnot3-cKO. (E) Hematoxylin and Eosin-stained sections of testes of 6- and 8-week-old control and Cnot3-cKO males. Insets show whole testes. Arrowheads and asterisks indicate multinucleated degenerating cells and seminiferous tubules lacking germ cells, respectively. (F) Merged channels of single confocal sections of 8-week-old control and Cnot3-cKO testis showing SOX9 (green) and TRA98 (red) expression with DAPI (blue). Images are representative of at least three independent biological samples. w, weeks of age. Scale bars: 60 µm.
Fig. 2.
Fig. 2.
Cnot3 deletion causes depletion of ZBTB16+ spermatogonia and decrease of SSC maintenance. (A) Experimental scheme to achieve and analyze the deletion of Cnot3 in neonatal testis. Red arrows indicate sample collection time points. (B) Merged channels of single confocal sections of P6, P10 and P14 control and Cnot3-cKO testis showing CNOT3 (green) and DDX4 (red) expression with DAPI (blue). The number of positively labeled cells per tubule from at least three independent biological measurements are shown. ***P<0.001, ****P<0.0001 (two-tailed Kolmogorov–Smirnov test). (C) Merged channels of single confocal sections of P6, P10, P14 and P21 control and Cnot3-cKO testis showing CNOT3 (green) and ZBTB16 (red) expressing cells with DAPI (blue). The number of positively labeled cells per tubule from at least three independent biological measurements are shown. ****P<0.0001 (two-tailed Kolmogorov–Smirnov test). (D) Hematoxylin and Eosin-stained sections of testes of P14 WT and Cnot3-cKO males. Insets show whole testes. Images are representative of 5 control and 7 Cnot3-cKO samples. (E) Quantification of testis to body weight ratio of P14 control and Cnot3-cKO males. ***P<0.0001 (two-tailed, unpaired Student's t-test). Data are mean±s.e.m. n=5 for control; n=7 for Cnot3-cKO. (F) Merged channels of single confocal sections of P14 control and Cnot3-cKO testis showing SOX9 (green) and DDX4 (red) expressing cells with DAPI (blue). The number of positively labeled cells per tubule from at least three independent biological measurements are shown. ****P<0.0001 (two-tailed Kolmogorov–Smirnov test). (G) Merged channels of single confocal sections of P10 and P14 control and Cnot3-cKO testis showing STRA8 (green) and DDX4 (red) expression with DAPI (blue). The number of positively labeled cells per tubule from at least three independent biological measurements are shown. **P<0.01 (two-tailed Kolmogorov–Smirnov test). ns, not significant (P>0.05). (H) Merged channels of single confocal sections of P6, P10 and P14 control and Cnot3-cKO testis showing PCNA (green) and DDX4 (red) expression with DAPI (blue). The percentage of double-positive cells from at least three independent biological measurements is shown. ns, not significant (P>0.05; two-tailed Fisher's test). (I) Merged channels of single confocal sections of P10 and P14 control and Cnot3-cKO testis showing c-CASP3 (green) and DDX4 (red) expression with DAPI (blue). Arrows indicate c-CASP3 positive cells. The percentage of double-positive cells from at least three independent biological measurements is shown. *P<0.05, ****P<0.0001 (two-tailed Fisher's test). Scale bars: 20 μm. Box and whisker plots display the five-number summary: minimum, first quartile, median, third quartile and maximum.
Fig. 3.
Fig. 3.
Cnot3 deletion impairs the maintenance of steady-state spermatogenesis. (A) Reclustering of the group of cells containing SSCs and progenitor cells from the combination of our data with published datasets from P3, P6, P8, P10 and P15 stages (Law et al., 2019; Grive et al., 2019; Ernst et al., 2019). (B) Reclustering of the group of cells containing SSCs and progenitor cells from published datasets from P3, P6 and P15 stages, respectively (Law et al., 2019; Grive et al., 2019; Ernst et al., 2019). (C) Highlights of cell cycle phases in reclustered group of cells containing SSCs and progenitor cells from the combination of our data with published datasets from P3, P6, P8, P10 and P15 stages (Law et al., 2019; Grive et al., 2019; Ernst et al., 2019). (D) Reclustering and quantification of the groups of cells containing SSCs and progenitor cells from P8 control and Cnot3-cKO cells. (E) Highlights of Cnot3, stem cell (Lhx1 and Gfra1) and progenitor cell (Ngn3 and Ddit4) markers in reclustered group of cells containing SSCs and progenitor cells from P8 control and Cnot3-cKO cells. (F) Expression levels of stem cell (Lhx1, Zbtb16 and Gfra1) and progenitor cell (Ngn3 and Ddit4) markers in reclustered groups of cells containing SSCs and progenitor cells from the combination of our data with published datasets from P3, P6, P8, P10 and P15 stages (Law et al., 2019; Grive et al., 2019; Ernst et al, 2019).
Fig. 4.
Fig. 4.
CNOT3 is required for SSC maintenance and differentiation in vitro. (A) Expression levels determined by real-time RT-PCR of Cnot1, Cnot2, Cnot3, Gfra1, Zbtb16 and Sox9 genes relative to β-actin in adherent cells and SSCs derived from control testis. Mean±s.e.m. from three independent measurements are shown. (B) Expression level of Cnot3 relative to β-actin determined by real-time RT-PCR in SSCs derived from control (SSC) and Cnot3-cKO (SSC-Cre) and 0-5 days after 4-OHT treatment. Mean±s.e.m. from three independent measurements are shown. (C) Single and merged channels of SSCs derived from control and Cnot3-cKO testis showing CNOT3 (green) and DDX4 (red) expression. Cells were treated with 4-OHT for 72 h. The percentage of double-positive cells from at least three independent biological measurements are shown. ****P<0.0001 (two-tailed Fisher's test). (D) Single and merged channels of SSCs derived from control testis showing CNOT3 (green) and ZBTB16 (red) expression. (E) Single and merged channels of SSCs derived from control testis showing KIT (green) and DDX4 (red) expression (top) and STRA8 (green) and DDX4 (red) expression (bottom). Cells were treated with retinoic acid (RA; 1 μM) or vehicle for 24 h. The percentage of double-positive cells from at least three independent biological measurements is shown. ****P<0.0001 (two-tailed Fisher's test). (F) The protein level of CCR4-NOT subunits was detected by immunoblotting in control and Cnot3-cKO SSCs. Cells were treated with 4-OHT for 72 h and collected at the indicated time points. d, days after treatment. Feeder cells (STO) were used as a control. (G) The survival curve of control and Cnot3-cKO SSCs was determined. Cells were treated with vehicle or 4-OHT for 48 h. Then cells were replated at 2.5×10⁵ cells/well. Cell numbers were determined using a hemocytometer at the indicated time points. Mean±s.e.m. from three independent measurements are shown. (H) Number of SSCs after H2O2 treatment. Control and Cnot3-cKO SSCs were treated with 4-OHT for 48 h. H2O2 was added for 3 h to the cells, and cells were counted 48 h later. (I) Relative expression level of Cnot3 and Zbtb16 genes in control and Cnot3-cKO SSCs treated with 4-OHT for 48 h at the indicated time points. Mean±s.e.m. from three independent measurements are shown. (J) Single and merged channels of SSCs derived from Cnot3-cKO testis showing KIT (green) and DDX4 (red) expression with DAPI. Cells were treated with 4-OHT or vehicle for 72 h and with RA (1 µM) for 24 h before immunofluorescence staining on day 5. The percentage of double-positive cells from at least three independent biological measurements are shown. ****P<0.0001 (two-tailed Fisher's test). Scale bars: 20 μm in C,E; 50 μm in D,J.
Fig. 5.
Fig. 5.
Cnot3 deletion affects spermatogenic gene expression and GSH/ROS balance. (A) Volcano plot (log2 fold change versus −log10 P-value) of RNA-seq data from control and Cnot3-cKO ID4-EGFP+ undifferentiated spermatogonia at P8 (three biological replicates), identifying 798 and 137 genes upregulated and downregulated, respectively. (B) Gene ontology analysis of upregulated genes in Cnot3-cKO ID4-EGFP+ undifferentiated spermatogonia at P8. Pathways and genes involved in the GSH/ROS pathway are indicated in red. (C) Box plot showing the expression profile of the genes upregulated in Cnot3-cKO ID4-EGFP+ SSCs in undifferentiated spermatogonia stages A aligned (Aal) and A1 and differentiating spermatogonia A3, Intermediate B (InB) and preleptotene stages (RAs) (Kirsanov et al., 2023). (D) Expression level of GSH pathway genes relative to expression of Actb in ID4-EGFP+ spermatogonia from control and Cnot3-cKO. Mean±s.e.m. from three independent measurements is shown *P<0.05, **P<0.01, ***P<0.001, ****P<0.0001 (two-tailed, unpaired Student's t-test). (E) Box plot showing the expression profile of the GSH pathway genes Gstm1, Gstm2, Gstm6, Gstm7, Gclc, Gsta4, Mgst1, Mt1 and Ptges in undifferentiated spermatogonia stages A aligned (Aal) and A1 and differentiating spermatogonia A3, Intermediate B (InB) and preleptotene stages (RAs) (Kirsanov et al., 2023). (F) Merged channels of single confocal sections of P10 control and Cnot3-cKO testis showing GSTM1 (green) and TRA98 (red) expression with DAPI (blue). Scale bar: 50 μm. Average±s.e.m. of mean GSTM1 signal intensity of positively labeled SSCs from at least three independent biological measurements are shown *P<0.05, **P<0.01 (two-tailed, unpaired Student's t-test). (G) Box and whisker plot of GSH levels measured by flow cytometry in control and Cnot3-cKO ID4-EGFP+ undifferentiated spermatogonia at P8. *P<0.05 (two-tailed, unpaired Student's t-test). (H) Box and whisker plot of ROS levels measured by flow cytometry in control and Cnot3-cKO ID4-EGFP+ undifferentiated spermatogonia at P8. *P<0.05 (two-tailed, unpaired Student's t-test). (I) TapeStation electrophoresis of poly(A) tail generated by the extension poly(A) test (ePAT), for the indicated transcripts at P8. *P<0.05, **P<0.01 (two-tailed, unpaired Student's t-test). ns, not significant (P>0.05). (J) Examination of mRNA stability for the indicated genes. Cnot3-cKO SSCs were treated with (KO) or without 4-OHT (WT) for 48 h. Actinomycin D was added to the cells, and mRNA level was measured by RT-qPCR at the indicated time points. a.u., arbitrary units.

Update of

Similar articles

References

    1. Abby, E., Tourpin, S., Ribeiro, J., Daniel, K., Messiaen, S., Moison, D., Guerquin, J., Gaillard, J. C., Armengaud, J., Langa, F.et al. (2016). Implementation of meiosis prophase I programme requires a conserved retinoid-independent stabilizer of meiotic transcripts. Nat. Commun. 7, 10324. 10.1038/ncomms10324 - DOI - PMC - PubMed
    1. Agarwal, A. and Sekhon, L. H. (2010). The role of antioxidant therapy in the treatment of male infertility. Hum. Fertil. 13, 217-225. 10.3109/14647273.2010.532279 - DOI - PubMed
    1. Barati, S., Movahedi, M., Mazaheri, Z., Batooli, H. and Tahmasebi, F. (2015). Establishment of oxidative stress modeling during spermatogonial stem cells cultivation treated with different doses of H2O2. Anat. Sci. 12, 23-28.
    1. Bennett, B. D. and Bushel, P. R. (2017). goSTAG: gene ontology subtrees to tag and annotate genes within a set. Source Code Biol. Med. 12, 6. 10.1186/s13029-017-0066-1 - DOI - PMC - PubMed
    1. Berthet, C., Morera, A. M., Asensio, M. J., Chauvin, M. A., Morel, A. P., Dijoud, F., Magaud, J. P., Durand, P. and Rouault, J. P. (2004). CCR4-associated factor CAF1 is an essential factor for spermatogenesis. Mol. Cell. Biol. 24, 5808-5820. 10.1128/MCB.24.13.5808-5820.2004 - DOI - PMC - PubMed

MeSH terms

LinkOut - more resources