. 2025 Nov 3;13(11):1716-1731.
doi: 10.1158/2326-6066.CIR-25-0387.

Neoadjuvant Immunotherapy Promotes the Formation of Mature Tertiary Lymphoid Structures in a Remodeled Pancreatic Tumor Microenvironment

Affiliations

Neoadjuvant Immunotherapy Promotes the Formation of Mature Tertiary Lymphoid Structures in a Remodeled Pancreatic Tumor Microenvironment

Dimitrios N Sidiropoulos et al. Cancer Immunol Res. .

Abstract

Pancreatic ductal adenocarcinoma (PDAC) is a rapidly progressing cancer that responds poorly to immunotherapies. Intratumoral tertiary lymphoid structures (TLS) have been associated with rare long-term PDAC survivors, but the role of TLS in PDAC and their spatial relationships within the context of the broader tumor microenvironment remain unknown. In this study, we report the generation of a spatial multiomic atlas of PDAC tumors and tumor-adjacent lymph nodes from patients treated with combination neoadjuvant immunotherapies. Using machine learning-enabled hematoxylin and eosin image classification models, imaging mass cytometry, and unsupervised gene expression matrix factorization methods for spatial transcriptomics, we characterized cellular states within and adjacent to TLS spanning distinct spatial niches and pathologic responses. Unsupervised learning identified TLS-specific spatial gene expression signatures that are significantly associated with improved survival in patients with PDAC. We identified spatial features of pathologic immune responses, including intratumoral TLS-associated B-cell maturation colocalizing with IgG dissemination and extracellular matrix remodeling. Our findings offer insights into the cellular and molecular landscape of TLS in PDACs during immunotherapy treatment.


Figures

Figure 1.
Figure 1.
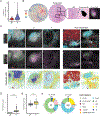
Spatial transcriptomics reveal a TLS transcriptomic signature in PDAC treated with neoadjuvant vaccine. A, Experimental and computational workflow for Visium spatial transcriptomics. B, Annotated Visium spatial transcriptomics of 14 frozen PDAC tumors and 2 adjacent lymph nodes. C, Heatmap showing top patternMarker genes and 10 spatial patterns inferred through CoGAPS analysis of the ST cohort, accompanied by adjacent heatmap showing aggregate values of each Pattern per pathology annotation. D-E, TLS pattern score (Pattern 9; Supplementary Data File S1) expressed on a subset of representative lymph node (D, sample 116_4, also shown in panel B) and PDAC samples enriched with TLS (E, sample 114_2, also shown in panel B). These representative samples are a subset of the frozen Visium dataset. Yellow boundaries overlayed on H&E correspond to pathologist’s annotation of germinal centers and immune aggregated are traced by a pathologist. F, TLS pattern score expressed across pathology annotations. G, Kaplan-Maier curve separating survival outcomes of TCGA-PAAD subjects expressing high (above 95th percentile, blue) versus low (<95th percentile, red) Pattern 9 projection values.
Figure 2.
Figure 2.
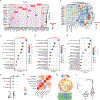
Intratumoral immunoglobulin spatial relationships in the TLS-enriched PDAC TME. A, Pathologic annotations, B, Pattern 9 enrichment, C, Pattern 2 enrichment, D, aggregate expression of Ig genes (IGHG1, IGHG2, IGHG3, IGHG4, IGKC, IGLC1, IGLC7, IGHM, IGHA1, JCHAIN), E, GOBP B cell activation gene set enrichment in representative sample with high TLS density (sample 116_1). F, Correlation plot of CoGAPS patterns, aggregate expression of Ig, and GOBP B cell activation gene set across ST data spots. G, Violin plot showing enrichment of GOPB B cell activation gene set across pathologist’s annotations. H, Stacked barplot showing Ig isotype gene usage by pathology annotations as proportion of total counts of Ig genes expressed per spot.
Figure 3.
Figure 3.
Leveraging a neoadjuvant immunotherapy clinical trial platform and spatial omics of resected pancreatic tumors to elucidate pathologic responses in PDAC tumors enriched in TLS. A, Study design of lymphoid organ spatial omics profiling in patients with PDAC evaluated for pathologic responses to neoadjuvant immunotherapy. Representative images to highlight the study design are shown again in Figure 4A. B, Illustration of CODA model training and identification of distinct tissue structures from model-classified image pixels in H&E-stained imaging on the Visium ST slide. Spatial plots demonstrate representative model annotations on H&E images of tumor and adjacent lymph node (sample P-45). C, Plot showing CODA model performance. Shown diagonally are the total number of pixels correctly predicted by CODA in the testing set when compared to pathology annotations. Precision per class as a percentage of correctly annotated pixels is shown in gray column. D-E, TLS niche compositions by CODA class, highlighting three TLS niche subclasses (D). E, Stacked barplot of 220 predicted TLS showing tissue composition of each of their niches ordered by decreasing ECM/stroma composition predicted by CODA.
Figure 4.
Figure 4.
Spatial transcriptomics of 12 FFPE samples from 8 PDAC tumors and 4 adjacent lymph nodes from pathologic responders and nonresponders. A, pathologist trained CODA H&E pixel classifier annotations shown next to H&E images across FFPE Visium dataset. B-C, Volcano plots illustrating differential gene expression results between responders and nonresponders in tumor (B) and LN ST data (C). D-E, Dotplot displaying average expression levels of Ig Genes (IGHG1, IGHG2, IGHG3, IGHG4, IGKC, IGLC1, IGLC7, IGHM, IGHA1, JCHAIN), plasma cell markers (CD38, TNFRSF17, SDC1/CD138, MZB1, IRF4, CD27, PRDM1, XBP1, CXCR4), and naïve B cell gene sets (CD19, MS4A1, IGHD, IGHM, CD79A) in TLS-annotated ST spots in TLS (D) and LN (E) of responders and nonresponders (E). F, Spatial plots of tumors displaying aggregate expression of Ig Genes. G. Magnified TLS in sample P-15 showing from left to right: plasma gene set, CD138, naïve B cell gene set expression and CODA annotations
Figure 5.
Figure 5.
Resolving TLS and their cellular niches at single cell resolution using imaging mass cytometry (IMC) reveals more mature TLS in responders in PDAC niches. A, Projected TLS maturation pattern from frozen ST cohort in TLS of FFPE cohort showging significantly higher projections in responders’ TLS ST spots (*** p<0.001 Wilcoxon). B, Spatial plot of IGHG2 expression and example workflow of IMC ROI selection in a tumor section (serially adjacent to ST) of a representative pathologic responder (sample P-15). Three ROIs are shown boxed on H&E image of sample P-15: necrotic duct (1), mature TLS (2), involuted TLS (3). H&E, CODA annotations and example marker expression is shown IMC ROI selected for mature TLS (2). Representative images to highlight the study design were shown previously in Figure 3. C, Three rows of panels showing expression of CD20 (blue), CK (red), CD3 (white), and PNAd (green); CD21 (green), CD45RO (pink), CCR7 (white) in each ROI on sample P-15. Morphologies are illustrated as centroids of single cells annotated from single cell clusters computed after image segmentation.D, CD138 and HLA-DR (E) expression in GC B cells in responders and non-responders (*** p<0.001 Wilcoxon). F, Neighbor composition of germinal center B cells in responder (R) and nonresponder (NR) TLS.
Figure 6.
Figure 6.
Spatially variable gene expression programs highlight spatial interactions between TLS maturation with ECM remodeling. A, Heatmap showing top patternMarker genes and 15 spatial patterns in ST data (NCT02451982; Supplementary Data File 2). B, Heatmap of aggregated pattern weights by ST histology annotations. C-E, SpaceMarker analysis of molecular changes from cell-cell interactions showing top enriched pathways at the intersection of TLS and stroma (C), islets (D), and PDAC patterns (E). F, Dot plot illustrating MHC Class II (REACTOME), leukocyte migration (KEGG), NK Mediated Cytotoxicity (KEGG), and TLS NMF Pattern 3 expression levels between responder and nonresponder TLS-annotated spots in tumors. G, Correlation plot of MHC Class II (REACTOME), leukocyte migration (KEGG), ECM degradation (REACTOME), NK Mediated Cytotoxicity (KEGG), TLS NMF Pattern 3, and Ig Genes across ST data in tumors. H, Spatial plot showing ECM degradation gene set expression in TLS enriched tumor (P_45). Boxed TLS area shown in serial slide stained with collagen hybridizing protein (CHP) and pseudocolored for CHP in green. I. CHP positive area at TLS border in pathologic responders vs. non responders (mixed linear effects testing correcting for individual TLS variation in size, *p<0.05).

References

    1. Chan TA, Yarchoan M, Jaffee E, Swanton C, Quezada SA, Stenzinger A, et al. Development of tumor mutation burden as an immunotherapy biomarker: utility for the oncology clinic. Ann Oncol 2019;30:44–56 - PMC - PubMed
    1. Yarchoan M, Hopkins A, Jaffee EM. Tumor Mutational Burden and Response Rate to PD-1 Inhibition. N Engl J Med 2017;377:2500–1 - PMC - PubMed
    1. Timmer FEF, Geboers B, Nieuwenhuizen S, Dijkstra M, Schouten EAC, Puijk RS, et al. Pancreatic Cancer and Immunotherapy: A Clinical Overview. Cancers (Basel) 2021;13
    1. Maleki Vareki S High and low mutational burden tumors versus immunologically hot and cold tumors and response to immune checkpoint inhibitors. J Immunother Cancer 2018;6:157. - PMC - PubMed
    1. Montagne JM, Jaffee EM, Fertig EJ. Multiomics Empowers Predictive Pancreatic Cancer Immunotherapy. J Immunol 2023;210:859–68 - PMC - PubMed

MeSH terms