. 2025 Nov;68(11):2609-2629.
doi: 10.1007/s00125-025-06515-2. Epub 2025 Aug 15.

Scavenging acrolein with 2-HDP preserves neurovascular integrity in a rat model of diabetic retinal disease

Affiliations

Scavenging acrolein with 2-HDP preserves neurovascular integrity in a rat model of diabetic retinal disease

Josy Augustine et al. Diabetologia. 2025 Nov.

Abstract

Aims/hypothesis: Diabetic retinal disease (DRD) is characterised by progressive neurovascular unit (NVU) dysfunction, often occurring before visible microvascular damage. Our previous studies suggested that the accumulation of acrolein (ACR)-derived protein adducts on retinal Müller cells and neuronal proteins may contribute to NVU dysfunction in diabetes, although this has yet to be directly tested. In this study, we evaluated the effects of the novel ACR-scavenging drug 2-hydrazino-4,6-dimethylpyrimidine (2-HDP) on retinal NVU dysfunction in experimental diabetes and explored its potential for systemic delivery in humans.

Methods: Sprague Dawley rats were divided into three groups: non-diabetic rats; streptozocin (STZ)-induced diabetic rats; and STZ-induced diabetic rats treated with 2-HDP in their drinking water throughout the duration of diabetes. Endpoint measures were taken at varying time points, ranging from 1 to 6 months post-diabetes induction. Retinal function and structure were evaluated using electroretinography (ERG) and spectral-domain optical coherence tomography (SD-OCT). Retinal vessel calibre, BP and vasopermeability (assessed by Evans Blue leakage) were also monitored. Immunohistochemistry was employed to assess retinal neurodegenerative and vasodegenerative changes, while cytokine arrays were used to investigate the effect of 2-HDP on diabetes-induced retinal inflammation. The accumulation of the ACR-protein adduct Nε-(3-formyl-3,4-dehydropiperidino)lysine (FDP-Lys) in human diabetic retinas was analysed. Computational chemistry simulations were performed to predict 2-HDP's passive permeability properties and its potential for systemic delivery.

Results: 2-HDP treatment had no effect on blood glucose, body weight, water intake, HbA1c levels or BP in diabetic rats (p>0.05). However, it protected against retinal FDP-Lys accumulation (p<0.05) and neurophysiological dysfunction, preserving ERG waveforms at 3 and 6 months post-diabetes induction (p<0.05 to p<0.001 for scotopic for a-wave, b-wave and summed oscillatory potentials). SD-OCT imaging revealed that 2-HDP prevented retinal thinning at 3 months (p<0.01) and protected against synaptic dysfunction, as evidenced by preserved synaptophysin expression (p<0.01 and p<0.001 for inner and outer plexiform layers, respectively). It also prevented neurodegeneration by maintaining retinal ganglion cells, amacrine cells, bipolar cells, and photoreceptors (p<0.05 to p<0.01). In addition, 2-HDP prevented retinal arteriolar dilation (p<0.01), reduced microvascular permeability (p<0.05) and attenuated microvascular damage, as indicated by preserved pericyte numbers and reduced acellular capillary formation (p<0.05). Mechanistically, 2-HDP inhibited microglial activation (p<0.05), suppressed the upregulation of proinflammatory molecules associated with NVU dysfunction in the diabetic retina (p<0.05 to p<0.001) and preserved the expression of the Müller cell glutamate-handling proteins, glutamate aspartate transporter 1 and glutamine synthetase (p<0.05 to p<0.01). FDP-Lys accumulation was observed in post-mortem human retinas from individuals with type 2 diabetes (p<0.05), in a pattern that was similar to that in the rat model of diabetes. Molecular dynamics simulations showed that the neutral form of 2-HDP readily crosses cell membranes, with enhanced permeation in the presence of ACR, highlighting its potential for systemic delivery.

Conclusions/interpretation: 2-HDP protects against retinal NVU dysfunction in diabetic rats by reducing FDP-Lys accumulation, preserving neuroretinal function and preventing microvascular damage, independent of glycaemic control. These results, combined with evidence from human diabetic retinas and molecular dynamics simulations, support 2-HDP's potential as a promising therapeutic agent for DRD, warranting further preclinical and clinical investigation.

Keywords: Nε-(3-formyl-3,4-dehydropiperidino)lysine (FDP-Lys); 2-Hydrazino-4,6-dimethylpyrimidine (2-HDP); Acrolein; Diabetic retinal disease (DRD); Electroretinography (ERG); Molecular dynamics (MD) simulations; Neurodegeneration; Neurovascular unit (NVU); Retinal inflammation; Vascular pathology.


Conflict of interest statement

Acknowledgements: We thank I. Micu and R. Delaney of the Advanced Imaging and Histology Core Technology Unit at Queen’s University Belfast for their technical assistance and use of the microscopes. We also thank the staff of the Biological Service Unit at Queen’s University Belfast for their care of the rats and assistance with animal procedures. Our sincere thanks go to the eye donors for their invaluable contribution to diabetic retinopathy research. Some of the data presented here were previously shared as a platform presentation titled ‘2-Hydrazino-4,6-dimethylpyrimidine (2-HDP) as a Novel Therapeutic for the Neurovascular Pathology of Diabetic Retinopathy’ at The Association for Research in Vision and Ophthalmology (ARVO) Annual Meeting 2022, held in Denver, USA, from 30 April to 4 May 2022. Data availability: The data supporting the findings of this study are available from the corresponding author upon reasonable request. Funding: This study was supported by grants from Diabetes UK (18/0005791), the Health & Social Care R&D Division, Northern Ireland (STL/4748/13) and the Medical Research Council (MC_PC_15026). The funding bodies had no involvement in the study’s design, data collection, analysis, interpretation or manuscript writing. Authors’ relationships and activities: The authors declare that there are no relationships or activities that might bias, or be perceived to bias, their work. Contribution statement: TC and AS conceived the project. JA, ET, TF, CB, EB, SA, PC, CM, AR and PB performed the experiments and analysed the data. ET and MU conducted the MD simulations. TL contributed human retinal samples and advised on the design and interpretation of these experiments. TC, JA and ET wrote, edited and reviewed the paper. All authors revised the paper for intellectual content and approved the final version for publication. TC is the guarantor of the integrity of the work.

Figures
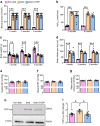
Fig. 1
Fig. 1
Metabolic and physiological characteristics of the experimental groups of rats. (ag) Bar charts show the effects of 2-HDP on diabetes-induced changes in blood glucose levels (a), HbA1c levels (b), body weight gain (c), water intake (d) and BP variables (eg). n=6–34 animals per experimental group. (h) Representative western blot showing FDP-Lys levels in retinas from non-diabetic, diabetic and 2-HDP-treated diabetic rats after 3 months of diabetes. Each lane represents an individual rat. (i) Bar graph showing that 2-HDP treatment reduces FDP-Lys accumulation in the diabetic retina. n=8 rats per experimental group. *p<0.05, **p<0.01 and ***p<0.001 for the indicated comparisons. Diab, diabetic
Fig. 2
Fig. 2
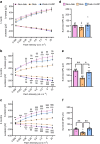
Deterioration of retinal neurophysiological function is attenuated by 2-HDP treatment in diabetic rats. Scotopic ERGs were performed on non-diabetic, diabetic and 2-HDP-treated diabetic rats at 1, 3 and 6 months of diabetes. (ac) Line graphs showing a-wave and b-wave amplitudes at 1 month (a), 3 months (b) and 6 months (c) of diabetes, at different flash intensities. (df) Bar graphs showing summed OP amplitudes at 1 month (d), 3 months (e) and 6 months (f) of diabetes. n=6 rats per group. Line graphs: *p<0.05, **p<0.01 and ***p<0.001 (non-diabetic vs diabetic); §p<0.05, §§p<0.01 and §§§p<0.001 (diabetic vs 2-HDP-treated diabetic). Bar graphs: *p<0.05 and **p<0.01 for the indicated comparisons. Diab, diabetic
Fig. 3
Fig. 3
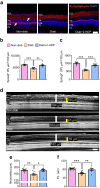
Synaptic and neurodegenerative changes are prevented by 2-HDP treatment in diabetic rats. (a) Representative retinal cryosection images from each experimental group after 6 months of diabetes, stained for synaptophysin (red) and DAPI (blue, nuclei). Synaptophysin-positive areas in the inner plexiform layer and outer plexiform layer are marked by white and yellow arrows, respectively. Scale bar, 50 μm. (b, c) Quantification of synaptophysin-positive areas in the inner (b) and outer (c) plexiform layer, normalised per 100 μm of retinal length. n=6 rats per group. (d) Representative SD-OCT images at 3 months of diabetes showing retinal (white) and photoreceptor layer (yellow) thickness measurements. Scale bar, 100 μm. (e, f) Bar graphs of retinal (e) and photoreceptor layer (f) thicknesses at 3 months. n=8–12 rats per group. *p<0.05, **p<0.01, ***p<0.001, for the indicated comparisons. Diab, diabetic; GCL, ganglion cell layer; IPL, inner plexiform layer; OPL, outer plexiform layer; PL, photoreceptor layer; Synapt, synaptophysin
Fig. 4
Fig. 4
2-HDP prevents the loss of retinal neurons after 6 months of diabetes duration in rats. (a) Representative retinal cryosections from each experimental group stained for brain-specific homeobox protein 3a (Brn3a)-positive RGCs (green, arrows) and DAPI (blue, nuclei). (b) Bar graph showing numbers of Brn3a-positive RGCs in the ganglion cell layer, normalised to 100 μm retinal length. (c) Representative cryosections stained for GABAergic amacrine cells (red, arrows) and DAPI. (d) Bar graph showing numbers of GABAergic amacrine cells in the INL, normalised to 100 μm retinal length. (e) Representative cryosections stained for protein kinase Cα (PKCα)-positive bipolar cells (green, arrows) and DAPI. (f) Bar graph showing numbers of PKCα-positive bipolar cells in the INL, normalised to 100 μm retinal length. (g) Representative cryosections stained for arrestin-positive cones (red, arrows) and DAPI. (h, i) Bar graphs showing the numbers of cone and rod photoreceptors in the photoreceptor layer, normalised to 100 μm retinal length. n=5 or 6 rats per experimental group. Scale bar, 50 μm. *p<0.05, **p<0.01. Brn3a, brain-specific homeobox protein 3a; Diab, diabetic; GABA, γ-aminobutyric acid; GCL, ganglion cell layer; PKCα protein kinase Cα; PL, photoreceptor layer
Fig. 5
Fig. 5
2-HDP prevents retinal vascular pathophysiology and pathology in diabetic rats. (a) Representative retinal fundus image with an inset showing an ARIA-processed image of arteriole diameters (red) measured 1–2 disc diameters from the optic nerve head. (b) Bar graph showing that 2-HDP prevents retinal arteriolar vasodilation after 3 months of diabetes. n=5 or 6 rats/group. (c) Bar graph of mean retinal Evans Blue leakage showing reduced vascular permeability with 2-HDP after 3 months of diabetes. n=8–14 rats/group. (d) Representative retinal wholemounts immunolabelled for neural/glial antigen 2-positive pericytes (green, arrows) and isolectin B4 (pseudo-coloured blue, endothelial cells) after 6 months of diabetes. Scale bar, 100 μm. (e) Bar graph quantifying capillary pericytes normalised per mm2 of retina. n=6 rats/group. (f) Representative retinal wholemounts immunostained for Col IV (red) and co-labelled with isolectin B4 (pseudo-coloured blue) 6 months after diabetes induction. Arrows indicate Col IV-positive, isolectin B4-negative acellular capillaries. Scale bar, 100 μm. (g) Bar graph quantifying acellular capillaries, normalised per mm2 of retina. n=6 rats/group. *p<0.05, **p<0.01, ***p<0.001. Diab, diabetic; Iso B4, isolectin B4; NG2, neural/glial antigen 2
Fig. 6
Fig. 6
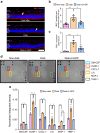
2-HDP prevents microglial and proinflammatory changes in the diabetic retina of rats. (a) Representative retinal cryosections stained for ionised calcium binding adaptor molecule 1 (IBA1; red) and counterstained with DAPI (blue) after 6 months of diabetes. Dendritic microglia are marked by white arrows and activated ‘amoeboid’ microglia are marked by yellow arrows, respectively. Scale bar, 50 μm. (b, c) Bar graphs showing numbers of total (b) and activated (c) microglia, normalised to 100 μm retinal length. n=5 rats per experimental group. (d) Representative cytokine array images from non-diabetic, diabetic and 2-HDP-treated diabetic rats after 3 months of diabetes. Each cytokine is spotted in duplicate, with the locations of GM-CSF, ICAM-1, CXCL-7, LIX, MCP-1 and TIMP-1 indicated. (e) Quantitative analysis of cytokine arrays was performed by densitometry, with values normalised to positive control spots on each membrane. GM-CSF, ICAM-1, CXCL-7, LIX, MCP-1 and TIMP-1 were upregulated in the diabetic retina and reduced by 2-HDP treatment. n=6 rats per experimental group with 2 or 3 technical replicates per group. *p<0.05, **p<0.01, ***p<0.001. Diab, diabetic; IBA1, ionised calcium binding adaptor molecule 1; GCL, ganglion cell layer; PL, photoreceptor layer
Fig. 7
Fig. 7
2-HDP improves glutamate-handling mechanisms in the diabetic retina in rats. (a) Representative retinal cryosections stained for GS (red) and counterstained with DAPI (blue) after 6 months of diabetes. (b) Bar graph showing the mean pixel intensity of GS immunolabelling in the retina. n=5 rats per group. (c) Representative western blot showing GS protein expression for each experimental group, with each lane representing an individual rat. (d) Bar graph showing that 2-HDP prevents GS downregulation after 3 months of diabetes. n=9 rats per group. (e) Representative retinal cryosections stained for GLAST-1 (green) with DAPI counterstain (blue) after 6 months of diabetes. (f) Bar graph showing the mean pixel intensity of GLAST-1 immunolabelling. n=5 or 6 rats per group. *p<0.05, **p<0.01. Scale bar, 50 μm. Diab, diabetic; GCL, ganglion cell layer; PL, photoreceptor layer
Fig. 8
Fig. 8
FDP-Lys accumulation in post-mortem retinas from individuals with type 2 diabetes. (a) Representative confocal images showing FDP-Lys (green) and GFAP (red) immunoreactivity in retinal sections from a non-diabetic individual and an individual with type 2 diabetes. Nuclei are counterstained with DAPI (blue). In images of retinal sections from individuals with diabetes, white and yellow arrows indicate FDP-Lys immunoreactivity in Müller cell end-feet at the inner limiting membrane and in their radial processes within the inner retina, respectively. (b, c) Bar graphs quantifying FDP-Lys immunoreactivity (b) and the number of GFAP-positive fibres (c) in the retinas of non-diabetic individuals and individuals with type 2 diabetes. Data represent three individuals per group. Scale bar, 50 μm. *p<0.05, ***p<0.001. Diab, diabetic; GCL, ganglion cell layer; PL, photoreceptor layer
Fig. 9
Fig. 9
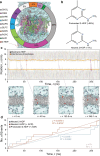
MD simulations of 2-HDP permeability across a human BBB model as a proxy for the iBRB. (a) Three-dimensional atomic-resolution representation of a human apical BBB microvascular endothelial cell membrane-mimetic system, used as a proxy to assess 2-HDP permeability across the human iBRB. The lipid composition includes cholesterol (CHOL), N-oleoyl-d-erythro-sphingosylphosphorylcholine (OSM), 1-stearoyl-2-arachidonoyl-sn-glycero-3-phosphoethanolamine (SAPE), 1-stearoyl-2-arachidonoyl-sn-glycero-3-phosphocholine (SAPC), 1-stearoyl-2-arachidonoyl-sn-glycero-3-phospho-l-serine (SAPS), 1-stearoyl-2-linoleoyl-sn-glycero-3-phosphocholine (SLPC), 1-stearoyl-2-oleoyl-sn-glycero-3-phosphoethanolamine (SOPE), 1-palmitoyl-2-oleoyl-sn-glycero-3-phosphocholine (POPC) and 1-stearoyl-2-arachidonoyl-sn-glycero-3-phosphoinositol (SAPI). The surrounding solution (150 mmol/l NaCl and water) is depicted as a semi-transparent cyan volume; see ESM Methods for full details on system construction, MD parameters and the theoretical framework and analysis used to calculate permeability. (b) Chemical structures of protonated and neutral 2-HDP, with the protonated form (>99%) dominating under physiological pH conditions. (c) Time-resolved centre-of-mass z positions of 40 neutral 2-HDP molecules (each assigned a unique colour along a rainbow spectrum) relative to membrane phosphate groups (orange) during a 275 ns NPT (constant number of atoms, temperature and pressure)-MD simulation. Representative snapshots at key time points show the initial configuration as well as some instances where neutral 2-HDP was passively translocating across the membrane, with molecules in the transbilayer region highlighted in red. (d) Accumulation of 2-HDP translocation events over time, comparing transport rates and linear fits for neutral 2-HDP with (crimson) and without (sky blue) equimolar ACR. Protonated 2-HDP (pink) showed no translocation events even with the leakier membrane in the presence of ACR. Neutral 2-HDP exhibited rapid translocation, which was further enhanced by ACR, yielding permeability within same order of magnitude as caffeine (see ESM Table 6 and ESM Fig. 2). The R2 values were calculated from linear regression on transition events logged over time, constrained to y=0 at t=0, representing the accumulated translocation events as a function of simulation time and emphasising overall trends in permeability and transport rate convergence rather than representing fine-grained temporal fluctuations

References

    1. GBD 2019 Blindness and Vision Impairment Collaborators, Vision Loss Expert Group of the Global Burden of Disease Study (2021) Causes of blindness and vision impairment in 2020 and trends over 30 years, and prevalence of avoidable blindness in relation to VISION 2020: the Right to Sight: an analysis for the Global Burden of Disease Study. Lancet Glob Health 9(2):e144–e160. 10.1016/S2214-109X(20)30489-7 - PMC - PubMed
    1. Amoaku WM, Ghanchi F, Bailey C et al (2020) Diabetic retinopathy and diabetic macular oedema pathways and management: UK Consensus Working Group. Eye (Lond) 34(Suppl 1):1–51. 10.1038/s41433-020-0961-6 - PMC - PubMed
    1. Moutray T, Evans JR, Lois N, Armstrong DJ, Peto T, Azuara-Blanco A (2018) Different lasers and techniques for proliferative diabetic retinopathy. Cochrane Database Syst Rev 3(3):CD012314. 10.1002/14651858.CD012314.pub2 - PMC - PubMed
    1. Stitt AW, Curtis TM, Chen M et al (2016) The progress in understanding and treatment of diabetic retinopathy. Prog Retin Eye Res 51:156–186. 10.1016/j.preteyeres.2015.08.001 - PubMed
    1. Virgili G, Curran K, Lucenteforte E, Peto T, Parravano M (2023) Anti-vascular endothelial growth factor for diabetic macular oedema: a network meta-analysis. Cochrane Database Syst Rev 6:CD007419. 10.1002/14651858.CD007419.pub7 - PMC - PubMed

LinkOut - more resources