. 2025 Aug 26;59(33):17773-17784.
doi: 10.1021/acs.est.5c03567. Epub 2025 Aug 15.

Photochemical Chain Scissions Enhance Polyethylene Glycol Biodegradability: from Probabilistic Modeling to Experimental Demonstration

Affiliations

Photochemical Chain Scissions Enhance Polyethylene Glycol Biodegradability: from Probabilistic Modeling to Experimental Demonstration

Kevin Kleemann et al. Environ Sci Technol. .

Abstract

Polyethylene glycols (PEGs), a major class of water-soluble polymers (WSPs), are widely used in diverse applications, from which PEGs may be released into the environment. This work investigates the effect of PEG reaction with photochemically produced hydroxyl radicals (OH), an important environmental oxidant, on the molecular weight (MW) distribution of PEGs and their subsequent biodegradation in soil and sediment. Monte Carlo simulations demonstrated a pronounced decrease in the PEG MW after only a few OH-reaction-induced chain scissions on initial PEG molecules. The simulation results were validated by experimentally reacting 13C-labeled PEGs (M¯n = 6380 ± 400 Da) with photochemically produced OH to three extents and by analyzing the formed low MW PEG reaction products. Incubation of unreacted and OH-reacted PEGs in both a sediment and a soil over 150 days demonstrated increasing rates and extents of PEG biodegradation into 13CO2 with increasing OH-reaction extent and thus increasing amounts of low MW PEG products. This work underscores the importance of considering WSP MW distributions and dynamics caused by biotic or abiotic chain scission reactions when advancing a detailed understanding of WSP fate and biodegradability in natural and engineered receiving environments.

Keywords: biodegradability; chain scission; environmental fate; hydroxyl radicals; molecular weight distribution; photochemical degradation; polyethylene glycol (PEG); sediment; soil.


Figures
1
1
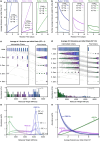
(a,b) Pseudo-first-order kinetic modeling of the reaction of polyethylene glycol (PEG) with hydroxyl radicals (OH) results in linear increases in the average number of scissions per initial chain ( SiC®) within a reaction time of 10 days (panel a), and an exponential decay of the number-average molecular weight ( n ) with reaction time t (panel b), calculated for three initial PEG n(t0) of 12 kDa (blue traces), 6 kDa (purple traces), and 3 kDa (green traces) at three environmental OH steady-state concentrations of [OH]SS = 10–15 M, 10–16 M, and 10–17 M (shades of the corresponding color). (c,d) A simulated reaction network plot illustrating the results of single Monte Carlo simulations with 20 initial PEG chains and simulation termination criteria of SiC® = 1 and 8 in panels c and d, respectively, with the resulting nr % (i.e., the number of PEG molecules with a given molecular weight (MW) in percent of the total number of chains obtained) contributions of individual PEG molecules of given MW plotted below and the initial MW distribution shown as a dashed line. The PEGs are color-coded according to MW ranging from high (blue) to medium (purple) to low (green) MWs. (e,f) Averaged results of 50 Monte Carlo simulations on 5000 initial PEG molecules with an initial MW distribution of 6380 ± 400 Da. Simulation results are depicted as weight percent (wt %) distributions of the MWs of PEG molecules after terminating simulations at SiC® of 1, 2, and 8 (relative to the initial distribution; SiC® = 0). Panel f shows the changes in the wt % contribution of PEG molecules with selected MWs (i.e., MW = 6380 Da (blue), MW = 4400 Da (purple), and MW = 440 Da (green)) with increasing simulated SiC® . The 95% confidence intervals of the simulated outputs are shown as shaded areas around the averages in panels (e,f).
2
2
(a) Chromatogram of the 13C-polyethylene glycol (PEG)-containing solution after a reaction time of t 1 = 15 min with hydroxyl radicals (OH), as analyzed by high-pressure liquid chromatography coupled to charged aerosol detection (HPLC-CAD). The retention time window from 200 to 400 min is shown in the inset, highlighting the well-separated peaks for individual 13C-PEG molecules with repeat unit numbers, n, from n = 75 (corresponding to a molecular weight (MW) of 3468 Da) to n = 87 (MW = 4020 Da). Peak integrals are given in light blue in the inset. PEG molecules with MWs below 2000 Da (green peak) and above 6400 Da (purple peak) are highlighted. The peaks detected by CAD were assigned to PEG molecules with specific MWs by parallel high-resolution mass spectrometry (HRMS) detection (see panels b,c and all spectra in Section S2, Supporting Information). (b) HRMS signal chromatogram of three individual ion traces with mass-to-charge ratios of m/z = 1758 (green trace), 1873 (blue trace), and 1988 (purple trace), with intensities normalized to the highest peaks. These peaks correspond to the elution of PEG molecules with n = 76, 81, and 86 repeat units (all z = 2). (c) Mass spectra of the eluting peaks with highest signal intensity in panel (b), showing the mass of the eluted PEG at different molecular charges z. (d) CAD peak integrals for each identified PEG over the MW range from 2000 to 6400 Da for the unreacted solution (i.e., t 0 = 0 min) and for the solutions reacted for t 1, t 2, and t 3 of 15, 30, and 45 min, respectively. (e) Cumulative abundance of PEG molecules as a function of MW, with abundance being calculated as the cumulative sum of CAD peak integrals up to the given MW normalized to the summed areas of all CAD peaks over the entire MW range (solid lines), including the poorly resolved features at <2000 Da and >6400 Da. The dashed lines and corresponding shades represent the best fits of the Monte Carlo simulation and their 95% confidence intervals to the experimental data.
3
3
Sediment and soil incubations to determine biodegradation of 13C-labeled polyethylene glycol (PEG) molecules that either were unreacted (i.e., t 0 = 0 min; dark blue; with a molecular weight (MW) distribution of 6380 ± 400 Da) or reacted with OH for increasing durations of t 1 = 15 min (dark cyan), t 2 = 30 min (dark green), and t 3 = 45 min (light green) and thus containing increasing amounts of low-MW PEG molecules. (a,c) Mineralization rates of 13C-PEG to 13CO2 normalized to the total added PEG-13C (expressed in % of added 13C per hour) and (b,d) the corresponding cumulative mineralization extents, 13CMineralized, expressed as CO213C formed in percent of initially added PEG-13C. Incubations in sediment of lake Rotsee (water-dispersed slurries, continuously stirred) and soil LUFA 6S (unsaturated pore water conditions, static) were run at 20 °C under oxic conditions. Nonmineralized PEG-added 13C that remained in the sediment of lake Rotsee (e) and soil LUFA 6S (f) at the end of the incubations (i.e., 13CNon‑Mineralized, in 13C in percent of total added PEG-13C) plotted with the corresponding cumulative mineralization extents at the end of the incubations (i.e., 13CMineralized, as 13CO2 in percent of total added PEG-13C; identical to final 13CMineralized data shown in panels (b,d). Mass balances on PEG-added 13C (i.e., 13CMineralized + 13CNon‑Mineralized in % of total added PEG-13C) were closed as shown by numbers close to 100% below the panels. Incubations were generally run in triplicate, except for t 0 (dark blue, LUFA 6S soil) which was run in duplicate due to limited incubator space. Although t 3 (light green, LUFA 6S soil) was initially run in triplicate, one incubation line malfunctioned, so only duplicate data were reported. Individual triplicate data are shown in panels (a–d), while averages and standard deviations (error bars) are shown in panel e and panel f.

References

    1. Hoffmann M. M.. Polyethylene Glycol as a Green Chemical Solvent. Curr. Opin. Colloid Interface Sci. 2022;57:101537. doi: 10.1016/j.cocis.2021.101537. - DOI
    1. Jang H.-J., Shin C. Y., Kim K.-B.. Safety Evaluation of Polyethylene Glycol (PEG) Compounds for Cosmetic Use. Toxicol. Res. 2015;31(2):105–136. doi: 10.5487/TR.2015.31.2.105. - DOI - PMC - PubMed
    1. Gaballa S., Naguib Y., Mady F., Khaled K.. Polyethylene Glycol: Properties, Applications, and Challenges. J. Adv. Biomedical Pharm. Sci. 2023;0(0):26–36. doi: 10.21608/jabps.2023.241685.1205. - DOI
    1. Kleemann K., Sander M.. Water-Soluble and Water-Dispersible Polymers Used in Commercial Agricultural Formulations: Inventory of Polymers and Perspective on Their Environmental Fate. Chimia. 2023;77(11):764–772. doi: 10.2533/chimia.2023.764. - DOI - PubMed
    1. Szymanski A., Wyrwas B., Lukaszewski Z.. Determination of Non-Ionic Surfactants and Their Biotransformation by-Products Adsorbed on Alive Activated Sludge. Water Res. 2003;37(2):281–288. doi: 10.1016/S0043-1354(02)00275-0. - DOI - PubMed

LinkOut - more resources