. 2025 Aug 1;6(8):e252669.
doi: 10.1001/jamahealthforum.2025.2669.

Validating 8 Area-Based Measures of Social Risk for Predicting Health and Mortality

Affiliations

Validating 8 Area-Based Measures of Social Risk for Predicting Health and Mortality

Aubrey Limburg et al. JAMA Health Forum. .

Abstract

Importance: Area-based measures of social risk are increasingly being used in policy applications in the US. While several have been demonstrated to be predictive of health and mortality in the general population, there is a need to identify area-based measures that are most reliable for policy applications, including measures that are associated with health and mortality consistently across subpopulations.

Objective: To compare the relative strength with which area and individual social risk measures are correlated with health outcomes and mortality, and the extent to which these associations are consistent across race, ethnicity, rurality, age, and gender.

Design, setting, and participants: This cross-sectional study included a sample of patients from primary care clinics across all 50 states that are part of the PRIME registry using electronic health records (2019-2021) linked to US Census Bureau restricted-use data at the individual level from 947 US primary care practices.

Exposures: Eight commonly used area based measures of social risk were examined: (1) Social Deprivation Index, (2) Social Vulnerability Index, (3) Area Deprivation Index (from University of Wisconsin), (4) Area Deprivation Index (constructed using Gophal Singh's original design), (5) Neighborhood Stress Score, (6) Index of Concentration at the Extremes for race and income, (7) French Index of Social Deprivation, and (8) the Community Resilience Estimates. Individual socioeconomic measures of education, poverty, and occupation were also examined.

Main outcomes and measures: Hypertension, diabetes, and chronic kidney disease derived from electronic health records, and mortality from the Census Numident.

Results: Data from 2 801 000 patients were analyzed. Among these, 44% were male individuals and 56% were female individuals; 20% were younger than 25 years, 23% were aged 25 to 44 years, 30% were aged 45 to 64 years, and 27% were aged 65 years and older; 0.5% were American Indian or Alaskan Native, 2.1% Asian, 7.6% Black, 0.2% Native Hawaiian and Pacific Islander, 0.03% were 2 or more races, and 70% were White. Area-based measures of social risk were generally better predictors of hypertension, diabetes, and chronic kidney disease, whereas individual socioeconomic measures were generally better predictors of mortality. The strongest predictor across health outcomes was the Area Deprivation Index, and that Gopal Singh's version was the most equitably predictive across rural areas and across all racial and ethnic subgroups.

Conclusions and relevance: In this cross-sectional study, area-based measures predicted health outcomes better than individual socioeconomic measures, and generally predicted health equitably across subpopulations; thus, their use should be considered in conjunction or instead of using individual-level measures for selected health policy applications.


Conflict of interest statement

Conflict of Interest Disclosures: Dr Limburg reported grants from Robert Wood Johnson Foundation during the conduct of the study. Dr Gladish reported grants from Robert Wood Johnson Foundation, nonfinancial support from the US Census Bureau, which provided data linkage and access under DRB approval, nonfinancial support from the American Board of Family Medicine (ABFM), which provided access to PRIME registry data and support for EHR linkage, and grants from the National Center for Advancing Translational Sciences of the National Institutes of Health (NIH-NCATS-CTSA) (UM1TR004921) during the conduct of the study. Dr Phillips reported grants from Robert Wood Johnson Foundation during the conduct of the study; and was a developer of the Social Deprivation Index, and has hosted workshops (philanthropy funded) to help policymakers, payers, and clinicians understand the value of using area-based deprivation indices to adjust payments to health care and to social services. Dr Phillips has also written (Health Affairs) about the problems with an error in the Area Deprivation Index (ADI) that could be repaired. In this paper, the ADI and the version that he and his coauthors repaired, both rise to the top for general use so there is no appearance of conflict with his role regarding the Social Deprivation Index. Dr Udalova reported grants from Robert Wood Johnson Foundation during the conduct of the study. No other disclosures were reported.

Figures

Figure 1.
Figure 1.. Correlations Between Area-Based Measures at the Census Block Group (CBG) and Census Tract (CT) and Individual Measures of Social Risk
Pearson correlation coefficients (all correlations are P < .001). The Census Bureau has reviewed this data product to ensure appropriate access, use, and disclosure avoidance protection of the confidential source data used to produce this product (Data Management System number: P-7532672, disclosure review board approval number: CBDRB-FY24-POP001-0090). Source: American Family Cohort (AFC) Data 2019 to 2021; American Community Survey (2005-2022). ACS indicates the American Community Survey; ADI-GS indicates Area Deprivation Index–Gophal Singh; ADI-UW, Area Deprivation Index–University of Wisconsin; CBG, Census Block Group; CRE, Community Resilience Estimates; CT ,Census Tract; FDep, French deprivation index; ICE wb-inc, Index of concentration at the extremes–income between Non-Hispanic White and Black populations; ICE wpc-inc, Index of concentration at the extremes–incomes between non-Hispanic White and persons of color; NSS7, Neighborhood Stress Score; SDI, Social Deprivation Index; SVI, Social Vulnerability Index.
Figure 2.
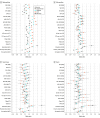
Figure 2.. Odds Ratios for Associations Between Area-Based and Individual Measures of Social Risk With Health Outcomes and Mortality
CKD indicates chronic kidney disease; CBG, census block group; CT, census tract. Models adjusted for age, race and ethnicity, gender, and rurality. The Census Bureau has reviewed this data product to ensure appropriate access, use, and disclosure avoidance protection of the confidential source data used to produce this product. (Data Management System number: P-7532672, disclosure review board approval number: CBDRB-FY24-POP001-0090). Source: American Family Cohort (AFC) data 2019 to 2021; American Community Survey (ACS) (2005-2022); census numident (Q3, 2023). ACS indicates the American Community Survey; ADI-GS indicates Area Deprivation Index–Gophal Singh; ADI-UW, Area Deprivation Index–University of Wisconsin; CBG, Census Block Group; CRE, Community Resilience Estimates; CT ,Census Tract; FDep, French deprivation index; ICE wb-inc, Index of concentration at the extremes–income between Non-Hispanic White and Black populations; ICE wpc-inc, Index of concentration at the extremes–incomes between non-Hispanic White and persons of color; NSS7, Neighborhood Stress Score; SDI, Social Deprivation Index; SVI, Social Vulnerability Index.
Figure 3.
Figure 3.. Odds Ratios for Associations Between Area and Individual Measures of Social Risk With Health Outcomes and Mortality, Stratified by Race
CKD indicates chronic kidney disease; CBG,census block group; CT, census tract. Models are unadjusted. The Census Bureau has reviewed this data product to ensure appropriate access, use, and disclosure avoidance protection of the confidential source data used to produce this product (Data Management System number: P-7532672, disclosure review board approval number: CBDRB-FY24-POP001-0090). Source: American Family Cohort (AFC) data 2019 to 2021; American Community Survey (ACS) (2005-2022); Census Numident (Q3, 2023). ACS indicates the American Community Survey; ADI-GS indicates Area Deprivation Index–Gophal Singh; ADI-UW, Area Deprivation Index–University of Wisconsin; CBG, Census Block Group; CRE, Community Resilience Estimates; CT ,Census Tract; FDep, French deprivation index; ICE wb-inc, Index of concentration at the extremes–income between Non-Hispanic White and Black populations; ICE wpc-inc, Index of concentration at the extremes–incomes between non-Hispanic White and persons of color; NSS7, Neighborhood Stress Score; SDI, Social Deprivation Index; SVI, Social Vulnerability Index.
Figure 4.
Figure 4.. Odds Ratios for Associations Between Area and Individual Measures of Social Risk With Health Outcomes and Mortality, Stratified by Ethnicity
CKD indicates chronic kidney disease; CBG, census block group; CT,census tract. Models are unadjusted. The Census Bureau has reviewed this data product to ensure appropriate access, use, and disclosure avoidance protection of the confidential source data used to produce this product (data management system number: P-7532672, disclosure review board approval number: CBDRB-FY24-POP001-0090). Source: American Family Cohort (AFC) data 2019 to 2021; American Community Survey (ACS) (2005-2022); Census Numident (Q3, 2023). ACS indicates the American Community Survey; ADI-GS indicates Area Deprivation Index–Gophal Singh; ADI-UW, Area Deprivation Index–University of Wisconsin; CBG, Census Block Group; CRE, Community Resilience Estimates; CT ,Census Tract; FDep, French deprivation index; ICE wb-inc, Index of concentration at the extremes–income between Non-Hispanic White and Black populations; ICE wpc-inc, Index of concentration at the extremes–incomes between non-Hispanic White and persons of color; NSS7, Neighborhood Stress Score; SDI, Social Deprivation Index; SVI, Social Vulnerability Index.
Figure 5.
Figure 5.. Odds Ratios for Associations Between Area and Individual Measures of Social Risk With Health Outcomes and Mortality, Stratified by Rurality
CKD indicates chronic kidney disease; CBG, census block group; CT, census tract. Models are unadjusted. The Census Bureau has reviewed this data product to ensure appropriate access, use, and disclosure avoidance protection of the confidential source data used to produce this product (Data Management System number: P-7532672, disclosure review board approval number: CBDRB-FY24-POP001-0090). Source: American Family Cohort (AFC) data 2019 to 2021; American Community Survey (ACS) (2005-2022); Census Numident (Q3, 2023). ACS indicates the American Community Survey; ADI-GS indicates Area Deprivation Index–Gophal Singh; ADI-UW, Area Deprivation Index–University of Wisconsin; CBG, Census Block Group; CRE, Community Resilience Estimates; CT ,Census Tract; FDep, French deprivation index; ICE wb-inc, Index of concentration at the extremes–income between Non-Hispanic White and Black populations; ICE wpc-inc, Index of concentration at the extremes–incomes between non-Hispanic White and persons of color; NSS7, Neighborhood Stress Score; SDI, Social Deprivation Index; SVI, Social Vulnerability Index.

Similar articles

References

    1. Phillips JRL, Ostrovsky A, Bazemore AW. Adjusting Medicare payments for social risk to better support social needs. Health Aff Forefr. Published online June 1, 2021. doi: 10.1377/forefront.20210526.933567 - DOI
    1. Schmidt H, Weintraub R, Williams MA, et al. Equitable allocation of COVID-19 vaccines in the United States. Nat Med. 2021;27(7):1298-1307. doi: 10.1038/s41591-021-01379-6 - DOI - PubMed
    1. Greenfield BK, Rajan J, McKone TE. A multivariate analysis of CalEnviroScreen: comparing environmental and socioeconomic stressors versus chronic disease. Environ Health. 2017;16(1):131. doi: 10.1186/s12940-017-0344-z - DOI - PMC - PubMed
    1. Lu JH, Callahan A, Patel BS, et al. Assessment of adherence to reporting guidelines by commonly used clinical prediction models from a single vendor: a systematic review. JAMA Netw Open. 2022;5(8):e2227779. doi: 10.1001/jamanetworkopen.2022.27779 - DOI - PMC - PubMed
    1. Breslau J, Martin L, Timbie J, Qureshi N, Zajdman D. Landscape of Area-Level Deprivation Measures and Other Approaches to Account for Social Risk and Social Determinants of Health in Health Care Payments. RAND Health Care; 2022.

Publication types