. 2025 Aug 26;44(8):116145.
doi: 10.1016/j.celrep.2025.116145. Epub 2025 Aug 13.

Alpha-synuclein abundance and localization are regulated by the RNA-binding protein PUMILIO1

Affiliations

Alpha-synuclein abundance and localization are regulated by the RNA-binding protein PUMILIO1

Maximilian Cabaj et al. Cell Rep. .

Abstract

The protein α-synuclein, encoded by SNCA, accumulates in Parkinson's disease (PD) and other synucleinopathies for reasons that remain unclear. Here, we investigated whether SNCA is regulated in vivo by the RNA-binding protein PUM1. We establish that PUM1 binds to SNCA's 3' UTR in mouse and human cells. In induced neurons from patients with SNCA locus triplication, PUM1 mRNA levels are lower than in healthy controls, but increasing PUM1 normalizes both SNCA mRNA and α-synuclein protein levels, largely by suppressing the long 3' UTR SNCA isoform. In microfluidic chamber experiments, silencing PUM1 causes a redistribution of SNCA between the soma and axons. We also show that the previously described miR-7 regulation of SNCA mRNA requires PUM1. Lastly, we report finding several individuals with PD in clinical databases bearing variants in PUM1 that affect its RNA-binding ability. Understanding how RNA-binding proteins regulate α-synuclein could lead to viable new therapies for synucleinopathies.

Keywords: AGO2; CP: Molecular biology; CP: Neuroscience; PUM1; Parkinson’s disease; RNA-binding protein; SNCA; alpha-synuclein; miR-7.


Conflict of interest statement

Declaration of interests V.K. is a co-founder of DaCapo Brainscience, a company involved in neurodegenerative disease research.

Figures
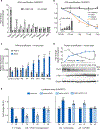
Figure 1.
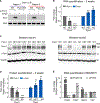
Figure 1.. PUM1 regulates SNCA by binding to both PREs in its 3′ UTR and is inversely correlated with α-Syn expression during development
(A) qPCR of PD risk genes with or without a PRE in their 3′ UTR, after knockdown or overexpression of PUM1 in HEK293T cells. SNCA showed the strongest response to changes in PUM1 expression. ATXN1 was used as a positive control and FEV as a non-PD-related negative control. Data were normalized to GAPDH and then compared to cells treated with an empty vector for PUM1 overexpression (OE) and siScramble for PUM1 knockdown experiments. (B) qPCR in HEK293T cells transfected with 0.5–2 μg of PUM1. Data were normalized to GAPDH and then compared to cells treated with an empty vector. (C) qPCR of Pum1 and Snca from brains of wild-type (WT) mice from gestation (embryonic day 14.5) to young adulthood (post-natal 120 days [P120]). Data were normalized to Gapdh mRNA levels. (D) Representative western blot and relative quantification of Pum1 and α-Syn protein levels from E14.5 to P120, confirming their inverse relationship. (E) Ratio of Renilla luciferase (RL) to firefly luciferase (FL) in HEK293T cells transfected with full-length SNCA 3′ UTR subcloned into the psiCHECK-2 vector, along with either overexpression (left) or silencing (right) of PUM1 in the context of mutating PRE1, PRE2, or both. Empty vector and siScramble were used as negative controls for PUM1 overexpression and silencing, respectively. All data represent the mean ± SEM from at least three biological replicates (indicated here as single dots). Statistical significance was calculated using Student’s t test: *p < 0.05, **p < 0.01, ***p < 0.001. See also Figure S1.
Figure 2.
Figure 2.. Pum1 regulates α-Syn protein and Snca mRNA levels in the mouse brain
(A) RNA-CLIP for the conserved Snca PRE, following immunoprecipitation (IP) against Pum1, in mouse brains at 3 weeks of age. The purple and red lines indicate PCR fragments upstream of the conserved Snca 3′ UTR PRE (508–515) (Figure S1D). IP against IgG and Pum1-KO mice were used as negative controls. RNA lysate from 10% of the pre-cleared lysate was used as input; see STAR Methods. (B) RNA quantification by qPCR of Pum1 and Snca from WT, Pum1-Het, and Pum1-KO mouse brains at 3 weeks of age. Data were normalized to Gapdh and represent means ± SEM from three biological replicates. (C and D) (C) Randomized and blinded western blots and (D) quantification of Pum1 and α-Syn from Pum1-Het and -KO mice, compared to WT animals at 3 weeks of age. Data were normalized to Gapdh. Data represent means ± SEM from four WT, eight Pum1-Het, and four Pum1-KO mouse brains, with equal numbers of males and females for each genotype. (E) qPCR of SNCA, PUM1, and FEV (negative control) after knockdown or overexpression (OE) of PUM2 in HEK293T cells. Data were normalized to GAPDH and then compared to cells treated with an empty vector for PUM2 overexpression and siScramble for PUM2 knockdown experiments. Statistical significance was determined by ANOVA and Student’s t test: *p < 0.05, **p < 0.01, ***p < 0.001.
Figure 3.
Figure 3.. Pum1 haploinsufficiency increases Snca RNA levels in specific brain regions and in individual neurons within the SNpc
(A) Magnified representative ISH sagittal images of Snca in the cortex, hippocampus, and substantia nigra pars compacta from WT, Pum1-Het, and Pum1-KO mouse cortex, hippocampus, and substantia nigra pars compacta (SNpc), taken from whole-brain images (Figure S3). The intensity of the ISH signal is color coded on a yellow-to-red gradient (low, yellow; medium, blue; high, red). Graphs to the right: the first column shows the total number of painted pixels; columns 2 through 4 show low-intensity (yellow), medium-intensity (blue), and high-intensity (red) bins, indicated by the color bar at the top of each panel (see STAR Methods). Each dot represents a single quantified section, with a total of eight sections per genotype. See also Figures S2, S4, and S5. (B) Representative RNAscope FISH images of coronal brain sections at 40× objective highlighting individual dopaminergic neurons from WT, Pum1-Het, and Pum1-KO mice at 3 weeks of age. A single Th-positive neuron is selected from the left panel (scale bar, 10 μm) of each genotype and shown in individual channels (merged, Th, Snca, and DAPI) in the right panels (scale bar, 4 μm). Each fluorescent particle on Snca channel represents one Snca mRNA molecule. Quantification of Snca mRNA particles per Th+ neuron for each genotype is shown on the right. Only non-overlapping, fully imaged Th+ neurons were included in the analysis. Each dot represents a single Th+ neuron: WT (n = 56 neurons), Pum1-Het (n = 58 neurons), and Pum1-KO (n = 56 neurons), with three mice per genotype. See also Figure S3. Data represent means ± SEM. Statistical significance was determined by ANOVA and Student’s t test: *p < 0.05, **p < 0.01, ***p < 0.001. See also Figures S2–S4.
Figure 4.
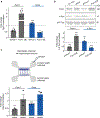
Figure 4.. Pum1 regulates α-Syn levels in rat hippocampal neurons
(A and B) shPum1 and Pum1 were virally delivered to primary rat hippocampal neurons and compared to a non-targeting control shRNA or empty vector, respectively (dotted line). (A) Snca and Pum1 mRNA and (B) α-Syn protein levels were then quantified as described in STAR Methods. Snca mRNA and α-Syn protein levels were reduced following Pum1 overexpression (OE) compared to the empty vector. Conversely, neurons transduced with shPum1 showed a modest upregulation of both Snca mRNA and α-Syn protein. Data represent means ± SEM from three biological replicates. Statistical significance was determined by Student’s t test: *p < 0.05, **p < 0.01, ***p < 0.001. (C) Top: schematic representation of the microfluidic chamber. Primary rat hippocampal neurons were cultured in the upper compartment and extended axons through 750-μm-long microgrooves into the axonal compartment. We administered shPum1 or shControl lentiviruses into the somatic compartment to knock down Pum1 before cell lysis and RNA quantification. Bottom: qPCR shows that Pum1 mRNA was reduced >50% in the soma but unaffected in the axons compared to shControl. Snca levels fell in the soma but were increased in the axons. Data were normalized to Rps19 mRNA levels. One-sample t test on fold-change values in each column compared to a hypothetical value of 1 (dotted line representing shControl); **p < 0.01, ***p < 0.001.
Figure 5.
Figure 5.. PUM1 regulates α-Syn in human PD neurons
(A) Quantification of PUM1 and SNCA mRNA by qPCR in male (left) and female (right) reprogrammed PD neurons and their respective isogenic controls, with and without PUM1 transfection. Data were normalized to GAPDH and compared to untreated control neurons. (B) Immunostaining (upper panels) and relative signal quantification (lower graphs) in male (left) and female (right) neurons reprogrammed from controls and patients with PD with SNCA triplication (four alleles, or 4× SNCA) and their isogenic controls. Staining for TUJ1 (purple), encoded by TUBB3, was used as a neuron-specific marker for internal quantification. DAPI staining (blue) was used as an internal control to label the nuclei, while staining for PUM1 (green) and α-Syn (red) was used to quantify their levels in PD reprogrammed neurons compared to their respective isogenic healthy controls with two SNCA alleles. Data represent the mean ± SEM from three technical and biological replicates (indicated here as single dots). Statistical significance was calculated using Student’s t test: *p < 0.05, **p < 0.01, ***p < 0.001. See also Figure S5.
Figure 6.
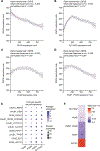
Figure 6.. PUM1 and SNCA are anti-correlated in human dopaminergic neurons in the substantia nigra pars compacta
(A–D) Locally estimated scatterplot smoothing (LOESS) plot of (A) PUM1 against SNCA, (B) SLC18A2 (used here as comparator) against SNCA, (C) PUM2 against SNCA, and (D) PUM1 + PUM2 against SNCA from single-nucleus RNA-seq of human samples shows a significant anti-correlation. (E) Dotplot showing PUM1, PUM2, SNCA, and SLC18A2 mRNA. (F) Summary of the Spearman rho correlation of PUM1, PUM2, SLC18A2, and AGTR1, against SNCA mRNA in the SNpc (used here as positive control). Statistical significance was calculated using a permutation test: *p < 0.05, and **p < 0.01. See also Figure S6.
Figure 7.
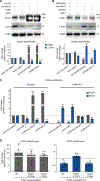
Figure 7.. miR-7 requires PUM1 to regulate α-Syn
(A and B) Representative western blot and relative quantification of PUM1 and α-Syn in HEK293T cells following either PUM1 or miR-7 overexpression alone or together (A), or after PUM1 knockdown (siPUM1) or miR-7 overexpression alone or together (B). Data were normalized to tubulin (TUBA) protein levels and represent means ± SEM from three biological replicates. Empty vector (control) and siScramble were used for overexpression and knockdown experiments, respectively. Cel-miR-67 was used as a negative control for miR-7 overexpression. (C) qPCR of PUM1 and SNCA following either PUM1 or miR-7 overexpression alone or together in WT or PUM1-KO HCT116 cell lines. SNCA is elevated in PUM1-KO cell lines, with reintroduction of PUM1 reducing levels to WT. miR-7 overexpression does not decrease SNCA mRNA in the absence of PUM1. Data were normalized to GAPDH and represent means ± SEM from three biological replicates. (D) RNA quantification of PUM1 and SNCA after transfection with 200–400 ng of either PUM1-WT, PUM1-P760L, and PUM1-P1021L in HEK293T cells. Data were normalized to GAPDH and non-transfected cell lines and represent means ± SEM from three biological replicates. Statistical significance was determined using Student’s t test: *p < 0.05, **p < 0.01, ***p < 0.001. See also Figure S7.

References

    1. Hickman RA, Faust PL, Marder K, Yamamoto A, and Vonsattel JP (2022). The distribution and density of Huntingtin inclusions across the Huntington disease neocortex: regional correlations with Huntingtin repeat expansion independent of pathologic grade. Acta Neuropathol. Commun. 10, 55. 10.1186/s40478-022-01364-1. - DOI - PMC - PubMed
    1. Ibanez P, Lesage S, Janin S, Lohmann E, Durif F, Destee A, Bonnet AM, Brefel-Courbon C, Heath S, Zelenika D, et al. (2009). Alpha-synuclein gene rearrangements in dominantly inherited parkinsonism: frequency, phenotype, and mechanisms. Arch. Neurol. 66, 102–108. 10.1001/archneurol.2008.555. - DOI - PubMed
    1. Caramiello AM, and Pirota V (2024). Novel Therapeutic Horizons: SNCA Targeting in Parkinson’s Disease. Biomolecules 14, 949. 10.3390/biom14080949. - DOI - PMC - PubMed
    1. Galvin JE, Lee VM, and Trojanowski JQ (2001). Synucleinopathies: clinical and pathological implications. Arch. Neurol. 58, 186–190. 10.1001/archneur.58.2.186. - DOI - PubMed
    1. McCann H, Stevens CH, Cartwright H, and Halliday GM (2014). alpha-Synucleinopathy phenotypes. Parkinsonism Relat. Disord. 20, S62–S67. 10.1016/S1353-8020(13)70017-8. - DOI - PubMed

LinkOut - more resources