. 2025 Aug 15;11(33):eadt5107.
doi: 10.1126/sciadv.adt5107. Epub 2025 Aug 15.

Large-scale protein interactome reveals lineage-specific genes driving plant-parasitic nematode adaptive innovations

Affiliations

Large-scale protein interactome reveals lineage-specific genes driving plant-parasitic nematode adaptive innovations

Guoqiang Huang et al. Sci Adv. .

Abstract

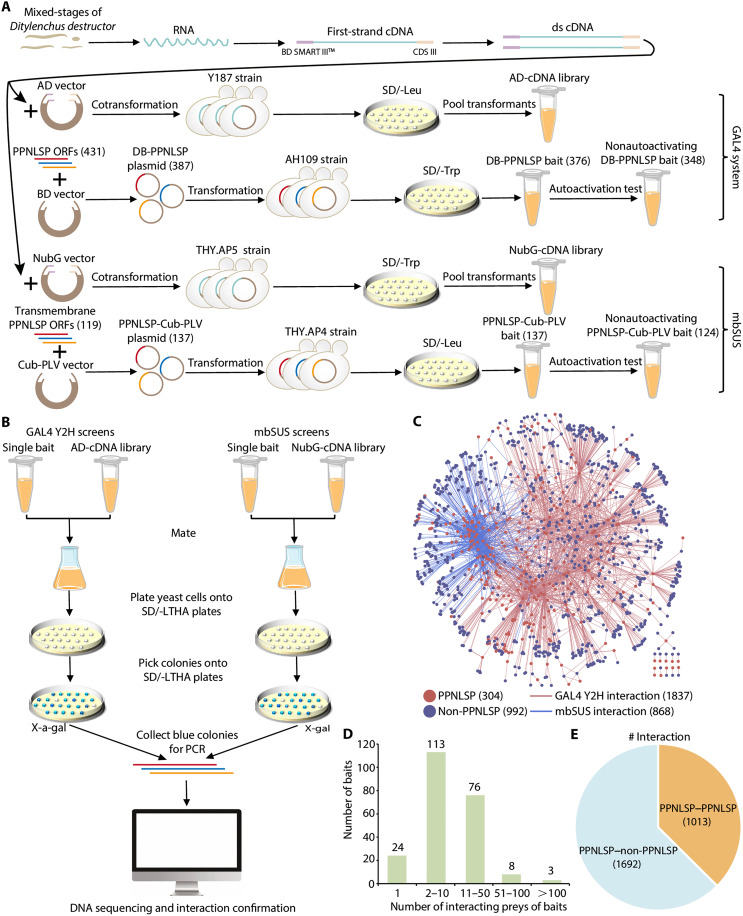
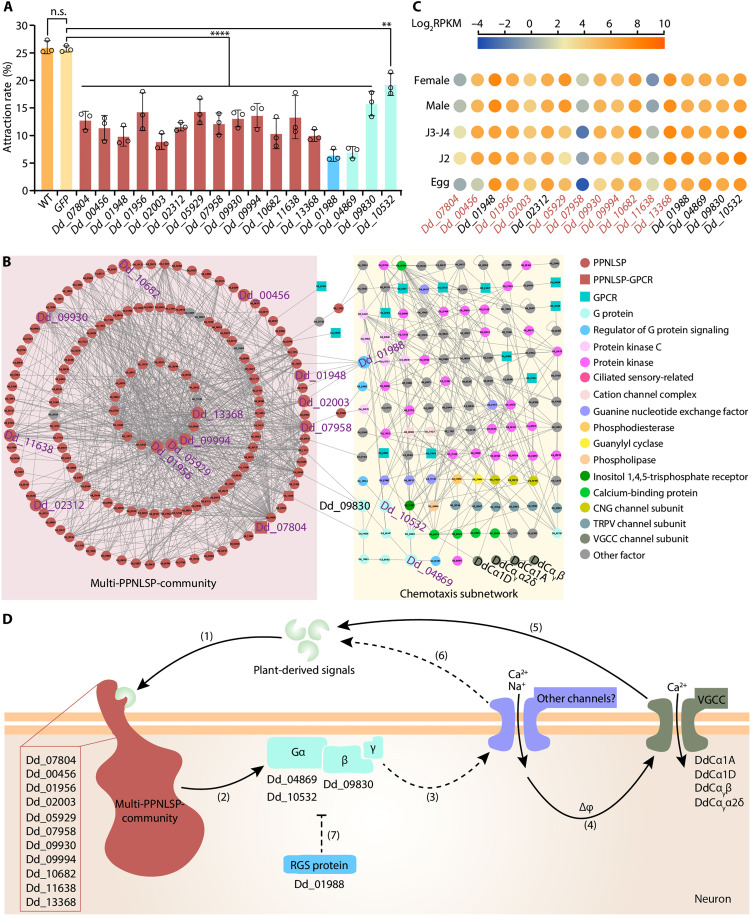
Mounting evidence suggests that lineage-specific genes drive phenotype diversity. Plant-parasitic nematodes (PPNs), among the most destructive plant pathogens, have evolved innovated traits required for plant parasitism, yet the genetic basis remains unclear. Here, we identify PPN lineage-specific genes (PPNLSGs) and analyze the large-scale protein interactome of their encoded proteins (PPNLSPs). By using yeast two-hybrid assays, we identify 2705 protein-protein interactions involving PPNLSPs from stem nematode Ditylenchus destructor, and by using computational methods, we predict conserved interactions of D. destructor proteins at the genome-wide level. Integration of these data allows generating a comprehensive protein interactome map, showing established complexes and PPNLSP modules, and allowing functional annotations for 306 uncharacterized PPNLSPs. Among these interactions, we identify multiple PPNLSPs associated with chemotaxis and infectivity based on these PPNLSP modules and propose a chemotaxis pathway model of host seeking. Our study indicates PPNLSGs as drivers of PPN adaptive innovations and provides a reference resource for future research on PPN biology and control strategies.


Figures

Fig. 1.
Fig. 1.. Identification, annotation, and expression analyses of PPNLSGs.
(A) Phylogenetic relationship of the selected nematode species for this work, which occupy a broad range of ecological niches. (B) Orthologs among five nematode species. Venn diagram shows a total of 14,280 gene families and the 340 families shared in all selected PPNs. The insert pie shows the number of PPNLSGs in each PPN, with their percentage proportion in total genome. (C) GO analysis of the PPNLSGs from D. destructor showing the top 15 enriched GO terms. (D) KEGG analysis of PPNLSGs from D. destructor showing the top 15 enriched pathways. (E) Distribution of Pfam protein domains for PPNLSGs from D. destructor. UDPGT, UDP-glucoronosyl and UDP-glucosyl transferase. GPCR, G protein–coupled receptor. N/A, no annotation. (F) Expression pattern analysis of PPNLSGs in D. destructor. Heatmap shows the clustered, row-scaled log2RPKM values for the 415 PPNLSGs across egg, J2, J3-J4, male, and female. RPKM, reads per kilobase of exon sequence in a gene per million mapped reads. (G) Expression clustering patterns of PPNLSGs from D. destructor with the count of clustered gene number. The value in parentheses in each cluster indicates cluster size (number of genes).
Fig. 2.
Fig. 2.. Generation of a binary protein interaction network for PPNLSPs from D. destructor genome using two different Y2H assays.
(A) Schematic depiction of the PPNLSP baits and cDNA libraries that were constructed for the two different Y2H assays: the GAL4 system and mbSUS assay. PPNLSP, PPN lineage-specific protein. (B) Schematic diagram of the two different Y2H assays and PPI identification. SD/–LTHA, synthetic dropout medium lacking leucine, tryptophan, histidine, and adenine. (C) Network graph of the Y2H interactions. The network consists of 2705 interactions among 1296 unique proteins, including 304 PPNLSPs. Red and blue nodes depict PPNLSPs and non-PPNLSPs, respectively. Red and blue edges represent protein interactions from GAL4 and mbSUS system, respectively. (D) Distribution of PPNLSP baits according to the numbers of their interacting preys. (E) Pie graph of the number of interactions of PPNLSP-PPNLSP and PPNLSP–non-PPNLSP observed on the network.
Fig. 3.
Fig. 3.. Delineation and validation of proteome-wide interaction network centered on PPNLSPs.
(A) Venn diagram of the interaction distributions among Y2H interactions, interologs, and DPIs. (B) Network graph of DdPPI. DdPPI consists of 11,843 interactions among 3260 proteins including 311 PPNLSPs. Red and blue nodes depict PPNLSPs and non-PPNLSPs, respectively. Red and blue edges represent protein interactions containing PPNLSPs (direct interactions) and indirectly connecting with PPNLSPs (expanded interactions), respectively. DdPPI, D. destructor protein–PPNLSP interaction network. (C) Pie graph of the number of true- and false-positive interactions verified by pairwise Y2H assays. (D) Numbers of retested PPNLSP-PPNLSP and PPNLSP–non-PPNLSP interactions, with the true- and false-positive rates. (E) Violin plots illustrating that the average expression correlation (Pearson’s r) of interacting protein pairs in DdPPI is significantly higher, compared to random protein pairs (P < 2.22 × 10⁻¹⁶; one-sided Wilcoxon rank-sum test). “*” indicates differences in the average expression correlation between DdPPI protein pairs and random protein pairs. (F) Violin plots illustrating that the average semantic similarities of GO terms of interacting protein pairs in DdPPI are significantly higher, compared to random protein pairs (P < 2.2 × 10⁻¹⁶; one-sided Wilcoxon rank-sum test). “*” indicates differences in the average semantic similarities of GO terms between DdPPI protein pairs and random protein pairs. BP, biological process. MF, molecular function. CC, cellular component. (G) In vitro confirmation of the PPIs identified in Y2H using the MBP pull-down assay. MBP-fusion proteins were incubated in binding buffer containing amylose agarose beads with or without GST-fusion proteins. Lysis of E. coli (Input) and eluted proteins (Pull-down) from beads were immunoblotted using anti-MBP and anti-GST antibodies. MBP, maltose-binding protein. GST, glutathione S-transferase. Two independent biological replicates of (a) to (e) were performed, with similar results.
Fig. 4.
Fig. 4.. Modules in DdPPI.
Graphical representation of DdPPI comprising 6840 clustered modules involving 11,268 interactions and 3259 proteins; see also data S13. Two hundred and twenty-one modules involving five or more proteins are indicated by colored regions; see also data S14. The remaining 11,047 modules as well as edges not clustered are shown as gray lines. Selected modules with known MF/biological role summarized by enriched GO terms or KEGG pathways are indicated. The multi-PPNLSP community containing 13 PPN modules as well as 143 PPNLSPs is highlighted with a dashed border. Interactions involving unannotated protein pairs are highlighted with a solid border. PPNLSPs and non-PPNLSPs are shown as red and blue nodes, respectively. CMG complex, Cdc45-minichromosome maintenance-GINS complex. SAGA complex, Spt-Ada-Gcn5-Acetyltransferase complex. CCR4-NOT complex, carbon catabolite repression 4-negative on TATA-less complex.
Fig. 5.
Fig. 5.. Transmembrane PPNLSPs and canonical chemosensory participants associated with D. destructor chemotaxis toward the host plant.
(A) Statistical analysis of effect of RNAi on chemotaxis of D. destructor. RNAi-treated worms displayed defective chemotaxis toward sweet potato blocks (n = 3, approximately 100 worms in each replicate). Worms that were treated with GFP dsRNA were used as negative controls. Three independent biological replicates were performed, with similar results. Mean ± SD is shown by error bar. The result designated with n.s. is not significant, whereas results designated with **P < 0.01, or ****P < 0.0001 are significant [one-way analysis of variance (ANOVA) with Dunnett’s multiple comparisons test]. (B) The multi-PPNLSP community (highlighted with pink background) connects with the predicted chemotaxis subnetwork (highlighted with yellow background). Canonical participants of sensory pathways are depicted with different colors and shapes. The 17 confirmed genes are depicted with amplified shapes and purple color. CNG channel, cyclic nucleotide-gated channel. TRPV channel, transient receptor potential vanilloid channel. VGCC, voltage-gated calcium channel. (C) Heatmap showing the log2RPKM values for the 17 confirmed genes across egg, J2, J3-J4, male, and female. Transmembrane PPNLSP genes are highlighted in red letters. (D) Model of host-plant seeking controlled by the multi-PPNLSP–community–G protein signaling–VGCCs pathway. The numbers (1) to (7) in this model show the main steps: (1) Plant-derived chemical signals bind to the GPCR (Dd_07804) or other transmembrane PPNLSPs from the multi-PPNLSP community; (2) activation of G protein–coupled signaling; (3) triggering other channels and generating membrane depolarization; (4) activation of VGCCs by membrane depolarization; (5) allowing chemosensory neurons to actively sense the chemical gradient thereby eliciting nematode chemotaxis toward the host plant. The activation of other channels may also trigger a chemosensory behavior of host localization directly (6). Signaling may also be down-regulated at the level of G proteins by the RGS protein (7).
Fig. 6.
Fig. 6.. PPNLSPs and their interactions that affect D. destructor infectivity.
(A to D) Statistical analysis of colonization and infection area of RNAi-treated D. destructor in sweet potato roots (n = 3 to 4, approximately 1000 mixed-stage nematodes in each replicate). The results are normalized as the percentage values relative to GFP control. The relative levels of infection area were analyzed using ImageJ. (E) Pairwise Y2H assays showing the Dd_07141–Dd_11417 and Dd_07141–Dd_04895 interactions. SD/–LTHA plates were used to test these interactions. (F) Representative images of infection areas. Infection areas are highlighted with a dashed border. (G) Statistical analysis of colonization and infection area of RNAi-treated D. destructor in sweet potato roots (n = 3 to 4, approximately 1000 mixed-stage nematodes in each replicate) from (F). The results are normalized as the percentage values relative to GFP control. Cosilencing of the interacting Dd_07141 and Dd_11417 genes significantly decreased nematode infectivity relative to either Dd_07141 or Dd_11417 silencing. The relative levels of infection area were analyzed using ImageJ. In all column graphs, mean ± SD is shown by error bar. Different letters indicate significant differences at P < 0.05 (one-way ANOVA with Duncan’s multiple range test).
Fig. 7.
Fig. 7.. M. incognita PPNLSGs relevant to plant parasitism.
(A) Relative expression of M. incognita genes after RNAi silencing determined by RT-qPCR. (B) Representative images of tobacco roots of different treatment groups. (Ba to Bc) Enlarged galls and egg masses. Arrowheads and arrows indicate galls and egg masses, respectively. For each group, 15 plants were observed. (C) Phenotypes of RNAi-treated M. incognita in tobacco roots. Acid fuchsin was used to stain tobacco roots 6 weeks after M. incognita infection. Arrowheads indicate females. For each plant, at least 10 roots were observed. (D) Statistical analysis of galls and egg masses of RNAi-treated M. incognita in tobacco plants (n = 15, each plant was inoculated with 300 M. incognita J2s). (E) The candidate parasitism PPNLSGs confirmed in both M. incognita and D. destructor could serve as potential target genes of broad spectrum and specific for the biological control of PPNs. siRNA, small interfering RNA. RISC, RNA-induced silencing complex. Two independent biological replicates of [(A) to (D)] were performed, with similar results. In all column graphs, mean ± SD is shown by error bar. Different letters indicate significant differences at P < 0.05 (one-way ANOVA with Duncan’s multiple range test).

Similar articles

References

    1. Erwin D. H., Novelty and innovation in the history of life. Curr. Biol. 25, R930–R940 (2015). - PubMed
    1. Wright C. J., Smith C. W. J., Jiggins C. D., Alternative splicing as a source of phenotypic diversity. Nat. Rev. Genet. 23, 697–710 (2022). - PubMed
    1. Kjer-Hansen P., Weatheritt R. J., The function of alternative splicing in the proteome: Rewiring protein interactomes to put old functions into new contexts. Nat. Struct. Mol. Biol. 30, 1844–1856 (2023). - PubMed
    1. Chen S., Krinsky B. H., Long M., New genes as drivers of phenotypic evolution. Nat. Rev. Genet. 14, 645–660 (2013). - PMC - PubMed
    1. Kaessmann H., Origins, evolution, and phenotypic impact of new genes. Genome Res. 20, 1313–1326 (2010). - PMC - PubMed

MeSH terms

Substances

LinkOut - more resources