. 2025 Aug 15;11(33):eads4473.
doi: 10.1126/sciadv.ads4473. Epub 2025 Aug 15.

HMGB1 deforms nucleosomal DNA to generate a dynamic chromatin environment counteracting the effects of linker histone

Affiliations

HMGB1 deforms nucleosomal DNA to generate a dynamic chromatin environment counteracting the effects of linker histone

Hayden S Saunders et al. Sci Adv. .

Abstract

The essential architectural protein HMGB1 increases accessibility of nucleosomal DNA and counteracts the effects of linker histone H1. However, HMGB1 is less abundant than H1 and binds nucleosomes more weakly, raising the question of how it competes with H1. Here, we find that HMGB1 increases nucleosomal DNA accessibility without displacing H1. HMGB1 also increases the dynamics of condensed, H1-bound chromatin. Unexpectedly, cryo-electron microscopy structures show HMGB1 bound at internal locations on nucleosomes and local DNA distortion. These sites are away from where H1 binds, explaining how HMGB1 and H1 can co-occupy a nucleosome. Our findings suggest a model where HMGB1 counteracts the effects of H1 by distorting nucleosomal DNA and disrupting interactions of the H1 carboxyl-terminal tail with DNA. Compared to mutually exclusive binding, co-occupancy by HMGB1 and H1 allows greater diversity in dynamic chromatin states. More generally, these results explain how architectural proteins acting at the nucleosome scale can have large effects on chromatin dynamics at the mesoscale.


Figures

Fig. 1.
Fig. 1.. HMGB1 grants access to nucleosomal DNA.
(A) A schematic of autoinhibition of HMGB1’s DNA binding A and B boxes by the negatively charged C-terminal tail. (B) A schematic of the REA assay showing how nucleosomal DNA cutting by the restriction enzyme PstI occurs when nucleosomal DNA transiently unwraps from the octamer core. The green star represents the fluorescent label on the end of the DNA. (C) Representative gels of time courses of REA on 10/10-Pst137 nucleosomes with (bottom) and without (top) the presence of 2.5 μM HMGB1. PstI cleavage results in the appearance of the lower, cut band over time. m, minutes. h, hours. (D) Quantification of three replicate experiments of (B). The fraction of DNA that remains uncut is plotted as a function of time. The data for all three replicates are fit by a two-step exponential decay function. (E) Rate constants (kfast and kslow) for REA experiments on 10/10-Pst137 nucleosomes are shown as a function of HMGB1 concentration. Error bars represent the SD for three separate replicates. (F) The fraction of nucleosomes that are described by kfast is plotted as a function of HMGB1 concentration. Error bars represent the SD for three separate replicates. Curve represents a fit by an equation derived from the model in (G). An overall half-maximal concentration of HMGB1 for its effect is 1.42 μM (K1/2). Inset shows the same plot with a logarithmic x axis. (G) A schematic of a model showing a slow and a fast-cutting population of nucleosomes that interconvert slowly relative to the timescale of PstI cutting and are bound by HMGB1 with different affinities. Kds is 2.4 μM while Kdf is 650 nM. Kds are derived from the equations in Materials and Methods.
Fig. 2.
Fig. 2.. HMGB1 distorts nucleosomal DNA at multiple sites.
(A) Cryo-EM density map of the A box of HMGB1 bound to a 0/10 nucleosome at SHL −2 at 2.9-Å resolution. (B) Atomic model built using the density in (A). (C) A comparison of the DNA bound by HMBG1 at SHL −2 (gray) to the unbound DNA at SHL +2 (teal), showing the widening of the minor grove by the HMG box. (D) An additional cryo-EM class revealed by cryoDRGN showing extra density for HMGB1 bound at SHL −6.
Fig. 3.
Fig. 3.. HMGB1 and H1 compete to tune nucleosomal DNA accessibility.
(A) Representative time-course gels of REA experiments in the presence of indicated concentrations of H1 and/or HMGB1. (B) The fraction of fast-cutting nucleosomes is shown as a function of HMGB1 concentration. Before HMGB1 is added, 10/10-Pst137 nucleosomes are either bound by no H1 (black), 15 nM H1 (coral), or 15 nM H1-∆CTE (green). Curve represents a fit by the equation derived from the model in (Fig. 1G). (C) Representative REA time courses of 40/40-Pst137 nucleosomes with or without H1 and/or HMGB1. (D) The fraction of fast cutting nucleosomes is shown as a function of HMGB1 concentration. 40/40-Pst137 nucleosomes are either bound by no H1 (black) or 20 nM H1 (coral) before HMGB1 was added. Curve represents a fit by the equation derived from the model in (Fig. 1G). K1/2 is 14.1 nM for nucleosomes alone and 112.6 nM for nucleosomes + H1. (E) A schematic of the predictions of the mutually exclusive binding model and the co-occupancy model. The mutually exclusive binding model would predict that saturating HMGB1 would displace H1 from nucleosomes, totally rescuing nucleosomal DNA accessibility. The co-occupancy model would predict that saturating HMGB1 would not displace H1 from nucleosomes and nucleosomal DNA accessibility would only be partially rescued, which is what is observed in (D).
Fig. 4.
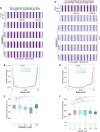
Fig. 4.. HMGB1 increases accessibility of DNA within chromatin.
(A) Heatmaps of SAMOSA-ChAAT experiments showing nucleosome footprints on a 12-by-601 array with a range of HMGB1 concentrations. Purple represents DNA that is accessible as assessed by the presence of adenine methylation. Gray represents DNA that is inaccessible as assessed by the lack of methylation and is interpreted as a nucleosome footprint. (B) The average methylation across every 601 sequence within the array is combined to show an average nucleosome footprint within the array. (C) Box and whiskers plot of nucleosome footprint size as a function of HMGB1 concentration. Solid line represents the median footprint size, while the height of the box represents the interquartile range, and the error bars represent the farthest data point within 1.5× the interquartile range from the box. Asterisks represent a P value < 0.01 on a two-tailed t test. n.s., not significant. (D) Heatmaps of SAMOSA-ChAAT experiments showing nucleosome footprints on a 12-by-601 array with H1 and a range of HMGB1 concentrations. Purple and gray represent accessible and inaccessible DNA, respectively as in (A). (E) The average methylation across every 601 sequence within the array is combined to show an average nucleosome footprint within the array. (F) Box and whiskers plot of nucleosome footprint size as a function of HMGB1 concentration. Solid line represents the median footprint size, while the height of the box represents the interquartile range, and the error bars represent the farthest data point within 1.5× the interquartile range from the box. Asterisks represent a P value <0.01 on a two-tailed t test. n.s., not significant.
Fig. 5.
Fig. 5.. HMGB1 increases the turnover dynamics of H1 and chromatin.
(A) Representative microscopy images of chromatin condensates. Thirty nanomolar Alexa Fluor 647–12-by-601 arrays are mixed with 360 nM Alexa Fluor 555–H1 and varying concentrations of HMGB1. Scale bar, 10 μm. (B) Violin plots of the quantification of the average Alexa Fluor 555–H1 fluorescence intensity within chromatin condensates. All values are normalized to chromatin and H1 alone with no HMGB1 added. Solid and dotted lines represent the median and interquartile values, respectively. Values represent an average of three experimental replicates with n > 10 condensates per replicate. Asterisks represent a P value < 0.01 on a two-tailed t test. (C) Quantification of the FRAP of Alexa Fluor 555–H1 within chromatin condensates. Values are normalized from 0 to 1 corresponding to post and prebleach, respectively. Points represent an average of three experimental replicates with n > 10 condensates per replicate. Error bars represent SD of all condensates within the three replicates. Data are fit to a one-phase exponentially association. (D to E) Violin plots of the quantification of the fits to the FRAP data in (C). The rate constant for recovery (kobs) and the plateau of recovery (Mobile Fraction) are plotted for the four different conditions in [(D) and (E)], respectively. Solid and dotted lines represent the median and interquartile values, respectively. Asterisks represent a P value < 0.01 on a two-tailed t test. (F) Quantification of the FRAP of Alexa Fluor 647–12-by-601 arrays within condensates. Values are normalized from 0 to 1 corresponding to post and prebleach, respectively. Points represent a single experimental replicate with n > 10 condensates. Error bars represent SD of all condensates. Data are fit to a one-phase exponentially association. (G and H) Violin plots of the quantification of the fits to the FRAP data in (F). The rate constant for recovery (kobs) and the plateau of recovery (Mobile Fraction) are plotted for the five different conditions in [(G) and (H)], respectively. Solid and dotted lines represent the median and interquartile values, respectively. Asterisks represent a P value < 0.01 on a two-tailed t test.
Fig. 6.
Fig. 6.. HMGB1 and H1 compete to regulate chromatin dynamics across scales.
(A) HMGB1 promotes unwrapping through interaction with the H3 tail. This replaces the H3 tail’s interaction with nucleosomal DNA and relieves autoinhibition of HMGB1, allowing the HMG boxes to bind and deform nucleosomal DNA. (B) When longer flanking DNA is present, HMGB1 is able to rescue H1 inhibition of DNA unwrapping. The extra flanking DNA allows additional HMGB1 molecules to interact, which loosens H1’s interaction with the flanking DNA, allowing HMGB1 to rescue DNA unwrapping. (C) HMGB1’s loosening of H1’s interaction with flanking DNA makes both H1 and chromatin itself more dynamic within condensed chromatin.

Update of

References

    1. Lorch Y., LaPointe J. W., Kornberg R. D., Nucleosomes inhibit the initiation of transcription but allow chain elongation with the displacement of histones. Cell 49, 203–210 (1987). - PubMed
    1. Clapier C. R., Iwasa J., Cairns B. R., Peterson C. L., Mechanisms of action and regulation of ATP-dependent chromatin-remodelling complexes. Nat. Rev. Mol. Cell Biol. 18, 407–422 (2017). - PMC - PubMed
    1. Anderson J. D., Widom J., Sequence and position-dependence of the equilibrium accessibility of nucleosomal DNA target sites. J. Mol. Biol. 296, 979–987 (2000). - PubMed
    1. Armeev G. A., Kniazeva A. S., Komarova G. A., Kirpichnikov M. P., Shaytan A. K., Histone dynamics mediate DNA unwrapping and sliding in nucleosomes. Nat. Commun. 12, 2387 (2021). - PMC - PubMed
    1. Bilokapic S., Strauss M., Halic M., Structural rearrangements of the histone octamer translocate DNA. Nat. Commun. 9, 1330 (2018). - PMC - PubMed