. 2025 Aug 15;11(33):eadv8918.
doi: 10.1126/sciadv.adv8918. Epub 2025 Aug 15.

Integration of spatial protein imaging and transcriptomics in the human kidney tracks the regenerative potential of proximal tubules

Affiliations

Integration of spatial protein imaging and transcriptomics in the human kidney tracks the regenerative potential of proximal tubules

Mahla Asghari et al. Sci Adv. .

Abstract

The organizational principles of nephronal segments are based on anatomical and physiological attributes that are linked to the homeostatic functions of the kidney. Recent molecular approaches have uncovered layers of deeper signatures and states in tubular cells that arise at various time points on the disease trajectory. Here, we introduce an analytical pipeline of multiplexed spatial protein imaging integrated with RNA expression to characterize proximal tubular subpopulations and neighborhoods in human kidney tissue. We demonstrate that, in reference tissue, a large proportion of S1 proximal tubular epithelial cells expresses thymus antigen 1 (THY1), a mesenchymal stromal and stem cell marker that regulates differentiation. Kidney disease is associated with loss of THY1 and transition toward expression of prominin 1 (PROM1), another stem cell marker recently linked to failed repair. Our data support a model in which the interplay between THY1 and PROM1 expression in proximal tubules associates with their regenerative potential and marks the timeline of disease progression.


Figures

Fig. 1.
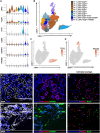
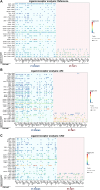
Fig. 1.. Cell classification based on CODEX imaging in reference and disease specimens.
Reference and disease specimens were stained and imaged using CODEX. (A) Heatmap showing the z-scaled mean fluorescence intensity for CODEX markers for all the cells segmented from the images of reference and disease kidney tissue sections. The specimen identification number and diagnosis are indicated on the left. IgA, immunoglobulin A; Ref, reference. (B) Violin plots showing the mean fluorescence intensity distribution per cell of the markers indicated in each of the cell clusters. (C) Uniform manifold approximation and projection (UMAP) plot of the Louvain clusters identified from the reference and disease specimens. The UMAP axis labels X1 and X2 represent abstract dimensions derived from the original data. Cell annotation was based on the marker expression profile (B) and mapping back of the clusters to the images (D to K). Distal convoluted tubules, connecting segments, and collecting duct cells could not be individually resolved on the basis of the markers used and are labeled collectively as distal nephron. [(D) to (G)] Representative CODEX images of select markers in reference tissue [(D) and (F)] and the corresponding cell clusters mapped back as nuclear overlays [(E) and (G)]. Scale bars, 500 μm. [(H) to (K)] Representative CODEX images of select markers in a kidney biopsy with chronic kidney disease (CKD) [(H) and (J)] and the corresponding cell clusters mapped back as nuclear overlays [(I) and (K)]. CDH1, Cadherin-1; Endo, endothelial cells; DCT, distal convoluted tubule.
Fig. 2.
Fig. 2.. Subclustering of PT cells identifies groups expressing injury and regenerative state markers.
Post-CODEX and –cell-type classification, PT cells were reclustered with a reduced set of molecular markers. (A) Violin plots showing the mean intensity distribution per cell of the markers relevant for each of the PT cell clusters. (B) UMAP plot visualizing the various PT clusters, highlighting the unique separation of the THY1-positive and PROM1-positive clusters. (C and D) Feature plots of THY1 and PROM1 expression. (E to G) Representative images from reference tissue showing staining of 4′,6-diamidino-2-phenylindole (DAPI), LRP2, THY1, CD68, and PROM1 [(E) and (F)] and mapping of the corresponding cell clusters as nuclear overlays (G). (H to J) Representative images from disease tissue with similar staining [(H) and (I)] and mapping of the corresponding cell clusters (J). Scale bar, 200 μm
Fig. 3.
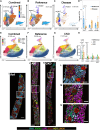
Fig. 3.. Bridging THY1 expression at the cell level from protein to RNA.
(A) Representative CODEX image of a reference tissue showing seven markers. (B) LRP2, PODXL, and THY1 expression registered on the sequential ST section stained with hematoxylin and eosin (H&E). THY1 colabels a subset of PT (LRP2-positive). (C) THY1 gene expression by ST registered with protein expression in CODEX. Clear/blue spots = minimal gene expression. Red/orange = higher gene expression. The black rectangle in (C) corresponds to (D) to (F). (D) H&E image from ST. (E) CODEX with LRP2, PODXL, and THY1 registered on the ST H&E image. (F) Yellow circles correspond to ST spots overlaying regions that are positive for LRP2 and THY1 proteins. Cyan circles correspond to ST spots overlaying regions that are LRP2-positive and THY1-negative protein. (G) Volcano plot of differentially expressed genes (DEGs) comparing the two sets of spots defined in (F) from combined three ST sections, [yellow versus cyan, statistical test: negative binomial generalized linear model, adjusted P < 0.05, |log₂FC (fold change)| > 0.25, n = 3]. (H) UMAP of PT class from KPMP snRNA-seq kidney atlas of health and disease (KPMP snRNA-seq atlas) clustered on the basis of highly variable gene expression. (I) Gene expression profile of the PT clusters from (H) displaying the genes uncovered in ST spots in (G) in addition to PROM1. Arrow indicates a subcluster with high expression of THY1. (J) Volcano plot comparing gene expression between THY1-positive PTs and all other PTs in the KPMP snRNA-seq atlas (statistical test: negative binomial generalized linear model, adjusted P < 0.05, |log₂FC| > 0.25, n = 29). (K) Violin plots comparing the expression of PROM1 and a subset of up-regulated genes from (J) in THY1-positive versus THY1-negative PTs. (L) Pathway analysis of differentially up-regulated genes in THY1-positive versus THY1-negative PTs. rRNA, ribosomal RNA; GTP, guanosine 5′-triphosphate; MAPK, mitogen-activated protein kinase; MHC, major histocompatibility complex; BRAF, V-Raf Murine Sarcoma Viral Oncogene Homolog B; EIF2AK4 or GCN2, Eukaryotic Translation Initiation Factor 2 Alpha Kinase 4; SLIT, Slit glycoprotein; ROBO, Roundabout receptor. Scale bars, 500 μm [(A) and (C)] and 200 μm (D).
Fig. 4.
Fig. 4.. Changes in THY1 expression in disease.
(A) Integrated UMAP of PT cells from the combined CODEX dataset, separated into reference (n = 5) or disease (n = 4) groups (B and C, respectively). (D) Quantitative analysis of cell proportions in reference and disease CODEX tissue sections [two-way analysis of variance (ANOVA) test, adjusted P < 0.05]. (E to G) Integrated UMAPs of PT cells from the combined PhenoCycler dataset visualized on the basis of condition: combined, reference, or CKD. (H) Quantitative analysis of cell proportions in reference (n = 13) and disease conditions (AKI, n = 15; CKD, n = 21) in the PhenoCycler dataset (two-way ANOVA test, adjusted P < 0.05). (I to K) Representative large-scale images of the PhenoCycler data showing THY1, PROM1, and markers for endothelium (CD31), PTs (LRP2), collecting ducts (AQP2), and thick ascending limbs (TAL) (UMOD). Scale bars, 500 μm. (L to N) Insets of the boxed areas from (I) to (K). Scale bars, 200 μm.
Fig. 5.
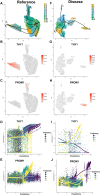
Fig. 5.. Trajectory analysis of PT cells accounting for the dynamics of THY1 and PROM1 expression in CODEX data.
Reference (n = 5) (A to E) or disease (n = 4) (F to J) samples were separated and reclustered and projected into UMAP space. (A) PT cell clusters from CODEX data in reference tissue with trajectory analysis (t1 to t5) starting from clusters of PT with high LRP2 expression. [(B) and (C)] Feature plots for THY1 and PROM1 expression in reference tissue samples. [(D) and (E)] Pseudotime spectrum of PT cells based on THY1 and PROM1 expression, in reference samples. (F) PT cell clusters from CODEX data in disease tissue with trajectory analysis (t1 to t4) starting from clusters of PT with high LRP2 expression. [(G) and (H)] Feature plots for THY1 and PROM1 expression in disease tissue samples. [(I) and (J)] Pseudotime spectrum of PT cells based on THY1 and PROM1 expression in disease samples.
Fig. 6.
Fig. 6.. Trajectory analysis of PT cells expressing high VCAM1 from the integrated phenocycler datasets of reference and disease.
(A) Integrated UMAP showing various PT cell clusters from Fig. 4E. (B) Trajectory analysis and pseudotime starting from the THY1+ PROM1+ clusters, which are also the cluster with high VCAM1 expression. (C to E) Feature plots for THY1, PROM1, and VCAM1. (F) Violin plots showing the distribution of THY1, PROM1, and VCAM1 expression among the various PT clusters. (G to I) Pseudotime spectrum of PT cell trajectories based on THY1, PROM1, and VCAM1 expression, respectively.
Fig. 7.
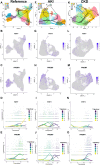
Fig. 7.. Trajectory analysis of PT cells accounting for the dynamics of THY1 and PROM1 expression in snRNA-seq data.
(A) PT cell clusters from the KPMP snRNA-seq data in reference tissues (n = 8 samples with 18,178 nuclei) with trajectory (t) analysis starting with a cluster of PTs without any injury markers and expressing genes known to be present in healthy differentiated PT cells. (B and C) Feature plots for THY1 and PROM1 expression in reference PT cells. (D and E) Pseudotime spectrum of PT cells based on THY1 and PROM1 expression for each of the trajectories shown in (A). (F to J) The same analysis performed in (A) to (E) was done on cells from AKI tissue specimens (n = 10 samples with 16,067 nuclei). (K to O) Similar analysis performed on cells from CKD tissue specimens (n = 11 samples with 13,953 nuclei).
Fig. 8.
Fig. 8.. Neighborhood analysis in CODEX data highlights epithelial immune cell interactions.
(A) t-SNE plot showing neighborhood clusters or niches (N1 to N19; each dot is a niche) based on the average distribution of cell types in each niche. The major cell type or tubular type in the underlying niches is indicated. (B) Distribution of specific cell types in all neighborhood clusters. (C) (Top) Distribution of cell types in neighborhoods and the propensity of niches to be found in reference or disease as assessed by odds ratio (OR) [P < 0.05, confidence interval (CI): 95%], and (C) (bottom) the average distribution of cell types in each niche. Undef., undefined. (D) Interactions of PT, immune cells, and fibroblasts in niches. Top: Chord plot to visualize the pairwise cell-cell interactions in all niches. Bottom: Pairwise correlation between cell types in all neighborhoods by Pearson’s coefficient (P < 0.05). Red boxes highlight negative correlation of THY1-positive PTs with immune cells, and green boxes highlight the positive correlation between the immune cells and PROM1-positive PTs.
Fig. 9.
Fig. 9.. Ligand-receptor analysis for PT cells from snRNA-seq data.
(A to C) Bubble plots from reference (n = 8 samples with 51,732 nuclei for all cells), AKI (n = 10 samples with 50,442 nuclei for all cells), and CKD (n = 11 samples with 40,450 nuclei for all cells) tissues showing the interactions of PROM1+ and THY1+ PTs with all other cells (x axis) and the ligand-receptor pairs used in such interactions (y axis) (one-sided permutation test, P < 0.05). See fig. S17 for all PT types and additional analysis. Commum.prob, communication probability.

Update of

References

    1. Lake B. B., Menon R., Winfree S., Hu Q., Melo Ferreira R., Kalhor K., Barwinska D., Otto E. A., Ferkowicz M., Diep D., Plongthongkum N., Knoten A., Urata S., Mariani L. H., Naik A. S., Eddy S., Zhang B., Wu Y., Salamon D., Williams J. C., Wang X., Balderrama K. S., Hoover P. J., Murray E., Marshall J. L., Noel T., Vijayan A., Hartman A., Chen F., Waikar S. S., Rosas S. E., Wilson F. P., Palevsky P. M., Kiryluk K., Sedor J. R., Toto R. D., Parikh C. R., Kim E. H., Satija R., Greka A., Macosko E. Z., Kharchenko P. V., Gaut J. P., Hodgin J. B., KPMP Consortium, Eadon M. T., Dagher P. C., El-Achkar T. M., Zhang K., Kretzler M., Jain S., An atlas of healthy and injured cell states and niches in the human kidney. Nature 619, 585–594 (2023). - PMC - PubMed
    1. Abedini A., Levinsohn J., Klotzer K. A., Dumoulin B., Ma Z., Frederick J., Dhillon P., Balzer M. S., Shrestha R., Liu H., Vitale S., Bergeson A. M., Devalaraja-Narashimha K., Grandi P., Bhattacharyya T., Hu E., Pullen S. S., Boustany-Kari C. M., Guarnieri P., Karihaloo A., Traum D., Yan H., Coleman K., Palmer M., Sarov-Blat L., Morton L., Hunter C. A., Kaestner K. H., Li M., Susztak K., Single-cell multi-omic and spatial profiling of human kidneys implicates the fibrotic microenvironment in kidney disease progression. Nat. Genet. 56, 1712–1724 (2024). - PMC - PubMed
    1. Muto Y., Wilson P. C., Ledru N., Wu H., Dimke H., Waikar S. S., Humphreys B. D., Single cell transcriptional and chromatin accessibility profiling redefine cellular heterogeneity in the adult human kidney. Nat. Commun. 12, 2190 (2021). - PMC - PubMed
    1. Canela V. H., Bowen W. S., Ferreira R. M., Syed F., Lingeman J. E., Sabo A. R., Barwinska D., Winfree S., Lake B. B., Cheng Y. H., Gaut J. P., Ferkowicz M., LaFavers K. A., Zhang K., Coe F. L., Worcester E., the Kidney Precision Medicine Project, Jain S., Eadon M. T., Williams J. C. Jr., El-Achkar T. M., A spatially anchored transcriptomic atlas of the human kidney papilla identifies significant immune injury in patients with stone disease. Nat. Commun. 14, 4140 (2023). - PMC - PubMed
    1. Wu H., Dixon E. E., Xuanyuan Q., Guo J., Yoshimura Y., Debashish C., Niesnerova A., Xu H., Rouault M., Humphreys B. D., High resolution spatial profiling of kidney injury and repair using RNA hybridization-based in situ sequencing. Nat. Commun. 15, 1396 (2024). - PMC - PubMed