. 2025 Aug;24(4):e70032.
doi: 10.1111/gbb.70032.

Training Schedule Affects Operant Responding Independent of Motivation in the Neuroligin-3 R451C Mouse Model of Autism

Affiliations

Training Schedule Affects Operant Responding Independent of Motivation in the Neuroligin-3 R451C Mouse Model of Autism

Riki Dingwall et al. Genes Brain Behav. 2025 Aug.

Abstract

Autism affects ~1 in 100 people and arises from the interplay between rare genetic changes and the environment. Diagnosis is based on social and communication difficulties, as well as the presence of restricted and repetitive behaviours. Autism aetiology is complex. However, the social motivation hypothesis proposes that an imbalance in the salience of social over non-social stimuli contributes over time to the autism phenotype. Accordingly, motivational dysfunction in autism is widespread, and human imaging data has identified broad impairments to reward processing. The R451C mutation of the neuroligin-3 gene is one such rare genetic change. Knock-in mice harbouring this mutation (NL3) exhibit a range of autism-related phenotypes, including impaired sociability and social motivation. However, no prior report has directly probed non-social motivation. Here, we explore conflicting results from the progressive ratio (PR) and conditioned place preference tasks of non-social motivation. Initial PR results were inconsistent, suggesting reduced, unaltered, and elevated non-social motivation, respectively. Utilising several experimental designs, we probed a range of confounders likely to influence task performance. Overall, reduced PR responding by NL3s likely arose from a combination of their superior ability to withhold responding during prior training and a short PR training schedule. Meanwhile, increased PR responding by NL3s was attributable to their heightened degree of habitual responding. The NL3 mouse model therefore likely best represents autistic individuals with intact non-social motivation but altered behavioural updating. Finally, we discuss the benefits and limitations of using heterogenous experimental designs to probe behavioural phenotypes and offer some general recommendations for PR.

Keywords: R451C; atomoxetine; autism; cocaine; methylphenidate; motivation; neuroligin‐3; study design; touchscreen.


Conflict of interest statement

The authors declare no conflicts of interest.

Figures
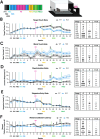
FIGURE 1
FIGURE 1
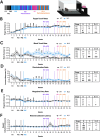
NL3 mice with prior training exhibit reduced responding during higher effort touchscreen fixed ratio. NL3 (n = 10) and WT (n = 12) mice underwent touchscreen FR, with expedited training due to their prior experience with the task apparatus. (A) This paradigm consisted of 25 sessions total with one FR1, one FR2, one FR3, one FR4 and four FR5 sessions prior to PR. PR then consisted of 6 consecutive sessions, followed by two baseline FR5 sessions, as well as three FR10, three FR20 and three FR40 sessions. (B) NL3 mice exhibited reduced target touch rates across most FR stages, though it was most pronounced at higher effort stages. (C) Similarly, NL3 mice had an elevated blank touch rate at higher effort FR stages, and (D) their discrimination ratio was accordingly impaired. (E) Meanwhile, there were small and inconsistent increases in magazine entry rate in NL3 mice. (F) However, NL3 mice exhibited comparable or even reduced collection latencies compared to WT mice. Solid vertical lines represent the transition from one FR stage to the next. Dashed vertical lines represent PR sessions that are represented elsewhere. All graphs are represented as mean ± SEM. ‘*’ denotes a significant genotype effect, ‘$’ denotes a significant session effect, and ‘#’ denotes a significant genotype by session interaction effect. FR, fixed ratio; G, genotype effect; G × S, genotype by session interaction; NL3, neuroligin‐3 R451C mouse model; PR, progressive ratio; S, session effect; WT, wild type. *p < 0.05, **p < 0.01, ***p < 0.001, $ p < 0.05, $$ p < 0.01, $$$ p < 0.001, # p < 0.05, ## p < 0.01, ### p < 0.001, n.s. = not significant.
FIGURE 2
FIGURE 2
NL3 mice with prior training exhibit reduced responding during consecutive touchscreen progressive ratio. NL3 (n = 10) and WT (n = 12) mice underwent six consecutive sessions of PR. (A) From Session 2 onwards, NL3 mice exhibited reduced breakpoints, defined as the last ratio performed either prior to timeout for 5 min of inactivity or after 1 h of testing. Throughout PR, NL3 mice had reduced (B) target touch rates, but comparable (C) blank touch rates to WT mice. (D) Their discrimination ratio was accordingly also impaired. NL3 mice exhibited broadly comparable (E) magazine entry rates and reduced (F) reward collection latencies. All graphs are represented as mean ± SEM. ‘*’ denotes a significant genotype effect, ‘$’ denotes a significant session effect, and ‘#’ denotes a significant genotype by session interaction effect. NL3, neuroligin‐3 R451C mouse model; WT, wild type.*p < 0.05, ***p < 0.001, $ p < 0.05, $$ p < 0.01, $$$ p < 0.001, # p < 0.05, ### p < 0.001, n.s. = not significant.
FIGURE 3
FIGURE 3
Extending fixed ratio overcame reduced responding in NL3 mice with prior training during higher effort fixed ratio by increasing general responsivity. NL3 (n = 16) and WT (n = 15) mice rapidly acquired the touchscreen FR/PR experiment due to their prior touchscreen training. However, training was extended to permit stabilisation of conditioned responses prior to progression to PR. (A) This iteration consisted of 34 sessions total with two FR1, two FR2, one FR3, and seven FR5 sessions prior to the first ATO drug probe. Four ATO drug probes were performed with interspersed FR5 sessions to allow for washout of the compound. Following the ATO probes and another FR5 washout session, mice underwent four consecutive PR sessions, before being baselined for one FR5 session and progressed to similarly interspersed PR probes with MPH. (B) NL3 mice exhibited reduced target touch rates compared to WT mice during early FR5 training, but this was attenuated by extending FR5 training. (C) Conversely, blank touch rates were elevated in NL3 mice during the later FR5 stages, (D) coinciding with a reduction in the discrimination ratio. (E) NL3 mice also exhibited reduced magazine entry rates early in FR training and (F) a consistent reduction in reward collection latency across FR training. Solid vertical lines represent the transition from one FR stage to the next. Dashed vertical lines represent PR sessions that are represented elsewhere. All graphs are represented as mean ± SEM. ‘*’ denotes a significant genotype effect, ‘$’ denotes a significant session effect, and ‘#’ denotes a significant genotype by session interaction effect. FR, fixed ratio; G, genotype effect; G × S, genotype by session interaction; NL3, neuroligin‐3 R451C mouse model; PR, progressive ratio; S, session effect; WT, wild type. *p < 0.05, **p < 0.01, $ p < 0.05, $$$ p < 0.001, # p < 0.05, ## p < 0.01, ### p < 0.001, n.s. = not significant.
FIGURE 4
FIGURE 4
Extending fixed ratio training in NL3 mice with prior training attenuated progressive ratio performance. NL3 (n = 16) and WT (n = 15) mice underwent four consecutive sessions of PR, as well as PR probes with intraperitoneal injections with saline and either 3 mg/kg ATO or 3 mg/kg MPH. There were no genotype differences in (A) breakpoint, (B) target touch rate, (C) blank touch rate, and (D) discrimination ratio between NL3 and WT mice. Meanwhile, (E) magazine entry rates were elevated in the final session, whereas (F) reward collection latencies were reduced in the NL3 mouse model throughout PR. (G) 3 mg/kg ATO reduced breakpoint across genotypes, though to a lesser degree in NL3 mice compared to WT mice, whereas (H) 3 mg/kg MPH increased breakpoint to a comparable degree in both genotypes. All graphs are represented as mean ± SEM. ‘*’ denotes a significant genotype effect, ‘$’ denotes a significant session effect, ‘#’ denotes a significant genotype by session interaction effect, ‘@’ denotes a significant drug effect, and ‘%’ denotes a significant genotype by drug interaction effect. ATO, atomoxetine; MPH, methylphenidate; NL3, neuroligin‐3 R451C mouse model; WT, wild type. *p < 0.05, **p < 0.01, $ p < 0.05, $$$ p < 0.001, # p < 0.05, ## p < 0.01, @@@ p < 0.001, % p < 0.05, %% p < 0.01.
FIGURE 5
FIGURE 5
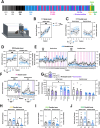
Naïve NL3 mice exhibit elevated fixed and progressive ratio responding following lever‐based operant training. Naïve NL3 (n = 10) and WT (n = 8) mice underwent a lever FR/PR schedule. (A) This paradigm consisted of 64 sessions in total with five FR1 SL, four FR1 DL, six FR3 and eight FR5 sessions prior to the first PR session. Thereafter, mice were progressed to a total of 16 PR sessions, four of which involved the intraperitoneal delivery of saline, 1 mg/kg ATO or 3 mg/kg ATO. These injection groups were counterbalanced across genotype and session. Following the final ATO drug probe, mice were assessed in a series of ramping high‐effort FR sessions: one FR10, one FR20 and one FR40. The operant apparatus was set up in the standard configuration with the active and inactive levers positioned either side of the reward magazine. (B) During FR1 SL, NL3 mice interacted less with the active lever during the first session, but otherwise demonstrated similar learning trajectories. (C) In FR1 DL, there were no genotype effects at the active or inactive lever, with task performance stabilising across the FR1 stages. (D) NL3 mice performed elevated active lever presses in the initial and two last sessions of FR3 training, though inactive lever presses remained rare and unaffected by genotype. (E) In FR5, prior to PR, there were no genotype effects in active lever presses for the first six sessions. However, NL3 mice exhibited elevated active lever responding for the final two sessions prior to the first PR session. (F) This elevated responding was carried forward into PR with intermittently increased active lever presses in NL3 mice during the initial PR sessions. Starting from the seventh PR session, NL3 mice experienced a spike in active lever responding, producing a larger genotype effect during the subsequent PR trials. (G) As such, mice progressed to the ATO probes at this late stage exhibited a strong genotype difference in active and inactive lever responding, even within the saline‐injected controls. Despite this, there was still a dose‐dependent drug effect, with 3 mg/kg ATO but not 1 mg/kg ATO reducing active lever responding. NL3 mice exhibited reduced inactive lever presses during (H) FR10 and (I) FR20 but no such effect was observed during (J) FR40. Dashed vertical lines represent PR sessions that are represented elsewhere in the figure. All graphs are represented as mean ± SEM. ‘*’ denotes a significant genotype effect, ‘$’ denotes a significant session effect, ‘#’ denotes a significant genotype by session interaction effect, and ‘&’ denotes a significant dose effect. ATO, atomoxetine; FR, fixed ratio; HRS, hours; NL3, neuroligin‐3 R451C mouse model; PR, progressive ratio; WT, wild type. *p < 0.05, $ p < 0.05, $$ p < 0.01, $$$ p < 0.001, # p < 0.05, ## p < 0.01, ### p < 0.001, & p < 0.05, && p < 0.01, &&& p < 0.001, n.s. = not significant.
FIGURE 6
FIGURE 6
Satiation probes during training and a limited number of sessions prevent habitual lever responding in NL3 mice. Naïve NL3 (n = 14) and WT (n = 15) mice underwent lever FR/PR testing. (A) In this experiment, mice were trained over 45 sessions, with four FR1 SL, four FR1 DL, four FR3, and four FR5 sessions prior to two satiation probes, with two FR5 sessions in‐between. Mice were then progressed to six sessions of FR5 to baseline before undergoing eight interspersed sessions of PR: Three of which involved intraperitoneal injections of saline, 1 mg/kg ATO or 3 mg/kg ATO. Drug groups were counterbalanced across genotypes and sessions. The lever apparatus was in a standard configuration with the active and inactive levers positioned either side of the reward magazine. (B) In FR1 SL, there were no genotype differences in active lever responding. (C) Similarly, in FR1 DL, active lever responses were unaffected by genotype, but the two genotypes reduced their inactive lever presses at moderately different rates across sessions. (D) During FR3, inactive lever presses were rare and did not exhibit genotype effects, while NL3 mice performed increased active lever presses in the latter portion of FR3 training. (E) This period of elevated active lever presses continued into the first few sessions of FR5, before attenuating prior to the satiation probes. Subsequent FR5 responses were negatively impacted by the satiation probes, but mice were successfully baselined with additional FR5 sessions. (F) During the satiation probes, both genotypes greatly reduced their interaction with the conditioned lever. However, NL3 mice exhibited elevated conditioned lever responding during the first satiation session, though this was absent in the second. (G) During PR, NL3 mice descriptively increased active and inactive lever responses over sessions, though overall genotype effects were absent across the reduced number of PR sessions. (H) Both 1 mg/kg ATO and 3 mg/kg ATO reduced active lever responding, though 3 mg/kg ATO produced larger effect sizes. These drug effects were observed in both WT and NL3 mice. Similarly, both 1 mg/kg ATO and 3 mg/kg ATO reduced inactive lever responding in both genotypes. Dashed vertical lines represent intervening PR sessions that are represented elsewhere in the figure. All graphs are represented as mean ± SEM. ‘*’ denotes a significant genotype effect, ‘$’ denotes a significant session effect, ‘#’ denotes a significant genotype by session interaction effect, ‘&’ denotes a significant dose effect, ‘@’ denotes a significant drug effect, and ‘+’ denotes a significant genotype by dose interaction effect. ATO, atomoxetine; DL, double lever; FR, fixed ratio; HRS, hours; NL3, neuroligin‐3 R451C mouse model; PR, progressive ratio; WT, wild type. *p < 0.05, **p < 0.01, $ p < 0.05, $$$ p < 0.001, # p < 0.05, ## p < 0.01, ### p < 0.001, &&& p < 0.001, @@ p < 0.01, @@@ p < 0.001, +++ p < 0.001.
FIGURE 7
FIGURE 7
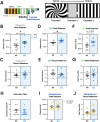
NL3 mice successfully develop a place preference following cocaine conditioning but exhibit hyperactivity. NL3 (n = 10) and WT (n = 8) mice successfully acquired a conditioned place preference. Mice were pseudo‐randomly assigned within genotypes to a reward‐associated chamber and tested for a minimum of 16 sessions. (A) These sessions included habituation, eight conditioning sessions, a conditioned place preference test, four extinction sessions, a place preference test following extinction, and a reinstatement probe. If mice continued to show a preference for their reward‐associated chamber during the place preference test following extinction, instead of progressing to reinstatement, mice would instead undergo two further extinction sessions before another place preference probe. This cycle occurred twice before all mice in the cohort successfully extinguished their conditioned place preference. The experimental apparatus consisted of a central chamber flanked by two larger chambers, each uniquely marked with high‐contrast patterns: spirals and vertical stripes. NL3 mice were hyperactive across (B) habituation and (D) CPP, with a trend suggesting hyperactivity during (F) the place preference session following extinction as well. (C) However, neither genotype displayed a chamber preference during habituation. (E) Both genotypes also successfully developed a comparable degree of conditioned place preference. (G) Similarly, both genotypes successfully extinguished their place preference and (H) underwent a similar number of extinction trials. (I) When i.p. injected with 10 mg/kg cocaine during reinstatement, both genotypes experienced cocaine‐induced hyperactivity. (J) Both genotypes also reinstated their conditioned place preference after receiving the previously associated reward. All graphs are represented as mean ± SEM. ‘*’ denotes a significant genotype effect. CPP, conditioned place preference; EPP, extinguished place preference; habit., habituation; NL3, neuroligin‐3 R451C mouse model; WT, wild type. *p < 0.05, n.s. = not significant.
FIGURE 8
FIGURE 8
Position of the response site does not alter the responding of NL3 mice during progressive ratio. NL3 (n = 5 beside, 5 opposite) and WT (n = 5 beside, 5 opposite) mice underwent a lever FR/PR task. (A) In this experiment, mice were trained for a maximum of 34 sessions, with 10 FR1 SL, seven FR1 DL, five FR3, and four FR5 sessions prior to the first PR session. Mice were then individually progressed to up to three 2‐h PR sessions interspersed with FR5 sessions. The final session was a 6‐h PR schedule. Each mouse underwent 6‐h PR only once, though they were spread across mice over 3 days. The operant apparatus was set up in both the standard and inverse configurations, meaning the levers were either beside the reward magazine or opposite the reward magazine, respectively. At progression, there were no genotype or lever location effects on active or inactive lever presses across (B) FR1 SL or (C) FR1 DL. (D) However, during FR3, NL3 mice performed fewer active lever presses during the first but not the subsequent three progression sessions. Mice in both genotypes exhibited more active lever presses when levers were in the standard configuration. (E) Despite this, no genotype effects were observed during subsequent FR5 training. Again, mice in the standard configuration exhibited elevated active lever responding. (F) There were no effects of genotype or lever location on active lever presses during either 2 or 6‐h PR. (G) Similarly, there was no effect of genotype or lever location on inactive lever presses during 2 or 6‐h PR. Dashed vertical lines represent PR sessions that are represented elsewhere in the figure. All graphs are represented as mean ± SEM. ‘*’ denotes a significant genotype effect, ‘$’ denotes a significant session effect, ‘#’ denotes a significant genotype by session interaction effect, and ‘~’ denotes a significant genotype by lever location interaction effect. FR, fixed ratio; HRS, hours; NL3, neuroligin‐3 R451C mouse model; PR, progressive ratio; WT, wild type. $$$ p < 0.001, # p < 0.05, ~ p < 0.05, ~~~ p < 0.01, n.s. = not significant.
FIGURE 9
FIGURE 9
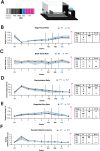
Naïve NL3 mice exhibit similar response patterns to wild‐type mice during touchscreen fixed‐ratio training. NL3 (n = 15) and WT (n = 12) mice underwent touchscreen FR/PR. (A) This paradigm consisted of 3 pre‐training sessions and 15 training sessions with five FR1, one FR2, one FR3, and two FR5 sessions. Mice were then progressed to six consecutive sessions of PR. (B) NL3 mice exhibited increased target touch rates only during FR2 and (C) comparable blank touch rates to WT mice throughout the entirety of FR training. Accordingly, (D) the discrimination ratio was largely unaltered across genotypes, though NL3 mice were improved in FR2 and one session of FR5. Meanwhile, (E) magazine entry rates were increased in the NL3 mice during FR2, but otherwise indistinguishable from WT mice. (F) Reward collection latencies were decreased in NL3 mice during early FR training, but this was attenuated by late FR training. Solid vertical lines represent the transition from one FR stage to the next. Dashed vertical lines represent PR sessions that are represented elsewhere. All graphs are represented as mean ± SEM. ‘*’ denotes a significant genotype effect, ‘$’ denotes a significant session effect, and ‘#’ denotes a significant genotype by session interaction effect. FR, fixed ratio; G, genotype effect; G × S, genotype by session interaction; NL3, neuroligin‐3 R451C mouse model; PR, progressive ratio; S, session effect; WT, wild type. *p < 0.05, **p < 0.01, $ p < 0.05, $$ p < 0.01, $$$ p < 0.001, # p < 0.05, ## p < 0.01, ### p < 0.001, n.s. = not significant.
FIGURE 10
FIGURE 10
Naïve NL3 mice exhibit similar responding to wild‐type mice during touchscreen progressive ratio. NL3 (n = 15) and WT (n = 12) mice underwent six consecutive sessions of PR; the first two sessions included a timeout, wherein 5 min of inactivity would result in early termination of the task. In the latter four sessions, however, this timeout was eliminated, and all mice were permitted an hour to perform the task. In this paradigm, there were no genotype effects on (A) breakpoint, (B) target touch rates, (C) blank touch rates, or (D) discrimination ratio. However, NL3 mice again exhibited (E) elevated magazine entry rates, though (F) indistinguishable reward collection latencies. Solid vertical lines represent the transition from PR sessions with a timeout for 5 min of inactivity to PR sessions without an inactivity timeout. All graphs are represented as mean ± SEM. ‘*’ denotes a significant genotype effect, ‘$’ denotes a significant session effect, and ‘#’ denotes a significant genotype by session interaction effect. NL3, neuroligin‐3 R451C mouse model; WT, wild‐type. *p < 0.05, $$ p < 0.01, $$$ p < 0.001, # p < 0.05, ## p < 0.01.

Similar articles

References

    1. American Psychiatric Association , Diagnostic and Statistical Manual of Mental Disorders, 5th ed. (American Psychiatric Association, 2022).
    1. Zeidan J., Fombonne E., Scorah J., et al., “Global Prevalence of Autism: A Systematic Review Update,” Autism Research 15, no. 5 (2022): 778–790, 10.1002/aur.2696. - DOI - PMC - PubMed
    1. Lai M. C., Anagnostou E., Wiznitzer M., Allison C., and Baron‐Cohen S., “Evidence‐Based Support for Autistic People Across the Lifespan: Maximising Potential, Minimising Barriers, and Optimising the Person–Environment Fit,” Lancet Neurology 19, no. 5 (2020): 434–451, 10.1016/S1474-4422(20)30034-X. - DOI - PubMed
    1. Qiu S., Qiu Y., Li Y., and Cong X., “Genetics of Autism Spectrum Disorder: An Umbrella Review of Systematic Reviews and Meta‐Analyses,” Translational Psychiatry 12 (2022): 249, 10.1038/s41398-022-02009-6. - DOI - PMC - PubMed
    1. Pugsley K., Scherer S. W., Bellgrove M. A., and Hawi Z., “Environmental Exposures Associated With Elevated Risk for Autism Spectrum Disorder May Augment the Burden of Deleterious De Novo Mutations Among Probands,” Molecular Psychiatry 27, no. 1 (2022): 710–730, 10.1038/s41380-021-01142-w. - DOI - PMC - PubMed

LinkOut - more resources