. 2025 Aug 15;16(1):7616.
doi: 10.1038/s41467-025-62614-z.

Compromise-free scaling of qubit speed and coherence

Affiliations

Compromise-free scaling of qubit speed and coherence

Miguel J Carballido et al. Nat Commun. .

Abstract

Across leading qubit platforms, a common trade-off persists: increasing coherence comes at the cost of operational speed, reflecting the notion that protecting a qubit from its noisy surroundings also limits control over it. This speed-coherence dilemma limits qubit performance across various technologies. Here, we demonstrate a hole spin qubit in a Ge/Si core/shell nanowire that triples its Rabi frequency while simultaneously quadrupling its Hahn-echo coherence time, boosting the Q-factor by over an order of magnitude. This is enabled by the direct Rashba spin-orbit interaction, emerging from heavy-hole-light-hole mixing through strong confinement in two dimensions. Tuning a gate voltage causes this interaction to peak, providing maximum drive speed and a point where the qubit is optimally protected from charge noise, allowing speed and coherence to scale together. Our proof-of-concept shows that careful dot design can overcome a long-standing limitation, offering a new approach towards building high-performance, fault-tolerant qubits.


Conflict of interest statement

Competing interests: The authors declare no competing interests.

Figures
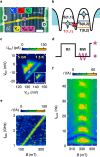
Fig. 1
Fig. 1. Measurement of a NW hole spin qubit at 1.5 K.
a False-color scanning electron micrograph of a representative NW-device. The Ge/Si NW is highlighted in yellow, lying on top of nine bottom gates, and is further connected to source and drain contacts from above, marked S and D. The first five bottom gates from the left were used to form a DQD, whose expected location is indicated by the yellow and pink ovals. The color code is consistently used throughout the manuscript. The scale bar corresponds to 100 nm. b Schematic of PSB. In the absence of a magnetic field and for detunings ε < εST, charge transport is blocked when the system is initialized in a triplet state T(1, 1). c Measurement of bias triangles with lifted spin-blockade at B = 350 mT (x-direction) and bias of VSD = +5 mV. The pink star marks the qubit initialization/readout spot, and the pink circle indicates the manipulation point. Inset: Same bias triangle at B = 0 mT, manifesting PSB via the suppressed current at the baseline. d Schematic of the pulse scheme applied to VRP, consisting of the readout/initialization stage (R/I) and the manipulation stage, for which a MW burst is applied while in Coulomb blockade. e Measurement of the current as a function of fMW and B showing characteristic EDSR at a fixed microwave burst duration. f Current as a function of microwave burst duration and magnetic field B at fL = 2.79 GHz, showing Rabi-oscillations with a frequency fRabi = 130 MHz and coherence time T2Rabi=40 ns.
Fig. 2
Fig. 2. SOI mediated g-factor renormalization of an elongated dot.
ac Experimental data of the qubit g-factor (solid black discs), the corresponding Rabi frequency fRabi (empty discs) and the estimated gtm-EDSR contribution fRabigtm (white bars), as a function of the barrier gate voltages VL, VM and VR, respectively. For each of the datasets (ac), the values on the other two barrier gates are fixed at the value marked by the vertical dashed line. The yellow colored regions highlight the voltage ranges for which the qubit driving mechanism is dominantly iso-EDSR, whereas the brown regions show the ranges for which the contribution to the measured fRabi originating from gtm-EDSR, fRabigtm, is ≥15% (5% above the spread of data points, see Supplementary Information). These colors are used consistently in all other panels. The estimated fRabigtm is represented by the white bar charts. d Schematic visualization of how the Zeeman vector g^0B is affected when subject to an infinitesimal voltage change dV in the presence of SOI represented by αSO and a fixed magnetic field ∣B∣. Left shows pure iso-EDSR coming from displacements of the dot potential. Right shows the additional appearance of gtm-EDSR, when the dot is displaced and deformed. e Shows the extracted ∂g/∂VRP, as a function of the voltage VL in blue, and f as a function of VM in red. These derivatives are used to calculate an upper bound of the g-modulated contribution to fRabi. g Values of the g-factor plotted versus their according fRabi from panels a (blue) and b (red). We exclusively show the data points for which iso-EDSR is the dominant driving mechanism (yellow regions), i.e., the gtm-EDSR contribution is ≤15% of the measured fRabi. We fit the data using Eq. (1), which assumes iso-EDSR (fit shown by black line with yellow highlight symbolizing iso-EDSR), yielding an intrinsic NW g-factor of gNW ≈ 1.
Fig. 3
Fig. 3. Compromise-free operation.
a Top: Experimental data of fRabi and g as a function of VL. Bottom: Dark blue circles show coherence times T2Hahn obtained from fits of the time-dependent readout current measured in Hahn-echo experiments at different voltages VL. Light blue circles show modeled coherence times taking into account gi(VL) from panels bf using Eq. (2), yielding SG=29nV/Hz. Vertical dashed line at VL = 1330 mV shows sweet spot, where T2Hahn is maximal. This spot coincides with fastest fRabi within experimental errors. Error bars correspond to standard deviations that result from fitting. Inset: Pairs of fRabi and T2Hahn from VL = 1330–1360 mV in 10 mV steps. bf Show gi(VL):=g/Vi(VL), as a function of different static voltages on gate VL. Dark blue data represent values of VL for which gi(VL) were measured. Light blue line represents linearly interpolated data needed to match the number of measured data points between gi(VL) and T2Hahn, which was fitted in (a). Vertical dashed line marks the sweet spot at VL = 1330 mV where all five gi(VL) reach near zero, defining the sweet spot. Horizontal dashed line marks the zero-line of the gi(VL). g The FACTOR: 2D voltage space showing T2Hahn as function of VM and VL. Filled circles represent measured coherence times T2Hahn extracted analogously to panel a. Data trace corresponding to the dark blue trace on panel a is referenced by the blue arrow on the 2D plot. An additional trace of T2Hahn as a function of VL for fixed VM = 630 mV is indicated by the vertical dark blue dashed line to the left end of the plot, as well as a trace of T2Hahn as a function of VM for fixed VL = 1320 mV which is indicated by the horizontal red dashed. Background is obtained by a Gaussian process interpolation serving as a guide to the eye. Black contours show a Gaussian process interpolation of measured Rabi frequencies, highlighting the overlap of maxima in T2Hahn and fRabi.

References

    1. Loss, D. & DiVincenzo, D. P. Quantum computation with quantum dots. Phys. Rev. A57, 120–126 (1998).
    1. Stano, P. & Loss, D. Review of performance metrics of spin qubits in gated semiconducting nanostructures. Nat. Rev. Phys.4, 672–688 (2022).
    1. Burkard, G., Ladd, T. D., Pan, A., Nichol, J. M. & Petta, J. R. Semiconductor spin qubits. Rev. Mod. Phys.95, 025003 (2023).
    1. Laucht, A. et al. A dressed spin qubit in silicon. Nat. Nanotechnol.12, 61–66 (2016). - PubMed
    1. Yoneda, J. et al. A quantum-dot spin qubit with coherence limited by charge noise and fidelity higher than 99.9%. Nat. Nanotechnol.13, 102–106 (2017). - PubMed

LinkOut - more resources