. 2025 Aug 15;16(1):7606.
doi: 10.1038/s41467-025-62881-w.

Basigin links altered skeletal stem cell lineage dynamics with glucocorticoid-induced bone loss and impaired angiogenesis

Affiliations

Basigin links altered skeletal stem cell lineage dynamics with glucocorticoid-induced bone loss and impaired angiogenesis

Thomas H Ambrosi et al. Nat Commun. .

Abstract

Glucocorticoid (GC) induced osteoporosis (GIOP) and osteonecrosis remain a significant health issue with few approved therapies. Here, we investigate the cellular and molecular processes by which GCs affect osteogenesis and angiogenesis. We find that GC treatment reduces bone mass through decreased bone formation by skeletal stem cells (SSCs). Concomitantly, endothelial cells increase in number but display distorted phenotypical features. Transplantation studies of SSCs combined with molecular analysis by single cell RNA-sequencing and functional testing of primary human cells tie GC-induced skeletal changes to altered stem cell differentiation dynamics. This in turn perpetuates reduced osteogenesis and vascular malformation through direct SSC-endothelial crosstalk mediated at least in part by Basigin. The genetic deletion of Basigin in the skeletal lineage as well as antibody-mediated blockade of Basigin during GC treatment prevents bone loss. Intriguingly, when administered to 2-year-old mice, anti-Basigin therapy reinstates bone remodeling to significantly improve bone mass. These findings provide therapeutic vantage points for GIOP and potentially other conditions associated with bone loss.


Conflict of interest statement

Competing interests: The authors declare no competing interests.

Figures
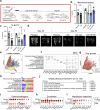
Fig. 1
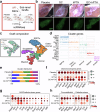
Fig. 1. A GC-mediated anti-osteogenic, pro-endothelial, pro-myeloid shift is reversed by hPTH.
a Experimental schematic for exposing mice to continuous glucocorticoids through subcutaneous Methylprednisolone treatment at two timepoints and varying interventions. Created in BioRender. Ambrosi, T. (2025) https://BioRender.com/8pmjxe4. b Mechanical strength test of femurs by 3-point bending. c Quantification of trabecular bone volume per total volume (Tb.BV/TV) shown as percentage change compared to day-0 age-matched controls. Analysis of femur bones from n = 8 biologically independent mice for Placebo and GC removal groups, n = 7 for GC d-28, n = 6 for GC d-56 and n = 9 for GC+hPTH. d Representative microCT images of distal femur trabecular bone at day-28 and day-56. Data shown as mean ± SEM. Statistical testing between Placebo and other group by two-sided unpaired Student’s t-test. *p < 0.05, **p < 0.01 ***p < 0.001, ****p < 0.0001. e UMAP of femur-derived single cells from all experimental groups and their distinct clustering by Leiden. f Specific markers of Leiden clusters determining cellular identity. g UMAP plot showing cellular clustering labeled by experimental group. h Bar graphs showing the relative abundance of each cell type captured for each experimental group. i Dotplot showing selected osteochondrogenic gene expression in mesenchymal cell subsets. j Global pathway enrichment analysis of the top 200 differentially expressed genes in mesenchymal cells of the GC group using EnrichR. k Dotplots of endothelial and l myeloid gene expression in vascular and hematopoietic cell types, respectively, between different experimental groups.
Fig. 2
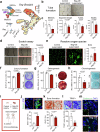
Fig. 2. GCs drive impaired skeletal stem and progenitor function and altered bone marrow blood vessel characteristics.
a Flow cytometry-based quantification of skeletal stem cell (SSC, CD45-Ter119-Tie2-CD90-6C3-CD105-CD51+[CD200+]) in femurs of experimental groups. n = 8 biologically independent mice for Placebo d-28 group, n = 7 for GC d-28 group, n = 5 for Placebo d-56 group, n = 3 for GC d-56 group, n = 6 for GC removal and GC+hPTH groups. b In vitro osteogenesis (Alizarin Red S stain) and c chondrogenesis (Alcian Blue stain) assays on purified, primary SSCs. Spectrophotometric quantification of staining (right). Cells from n = 3 biologically independent mice per group. d Flow cytometry-based quantification of endothelial cell populations (CD31+) in femurs of experimental groups. n = 4 biologically independent mice for Placebo d-28, n = 3 for GC d-28 and d-56 groups, n = 5 for Placebo d-56 and GC+hPTH groups, n = 6 for GC removal group. e Immunohistochemistry staining for Endomucin (Emcn) in bone marrow of day-56 placebo and GC-treated mice, as well as in 24-month-old wild-type mice. f Representative immunohistochemistry staining for Endomucin (Emcn) in bone marrow of day-56 experimental groups and quantification of blood vessel area (right top) and size of sinusoid lumen (right bottom) based on immunohistochemistry staining for Endomucin. n = 4. Arrows: sinusoids. All data shown as mean ± SEM. Statistical testing between Placebo and other groups by two-sided unpaired Student’s t-test. *p < 0.05, **p < 0.01 ***p < 0.001, ****p < 0.0001. Scale bars, 20 µm.
Fig. 3
Fig. 3. GC alters de novo in vivo bone formation by SSCs and the niches they generate.
a Experimental schematic of renal capsule transplants of freshly purified wild-type, GFP-labeled SSCs in mice exposed to placebo, GC, hPTH alone, or GC+hhPTH (hPTH 1-34). Created in BioRender. Ambrosi, T. (2025) https://BioRender.com/r8dp0jv. b Light microscopic images (top) and GFP signal of grafts formed beneath the renal capsule of transplanted mice. c Single-cell transcriptomic analysis of formed tissue grafts displayed as UMAP of single cells clustered by Leiden for cell type separation and by group (top left). SSPCs, skeletal stem and progenitor cells. d Tracksplot of specific markers of Leiden clusters determining cellular identity. e Bar graphs showing the relative abundance of each cell type captured for each experimental group. f Dotplot showing selected osteochondrogenic (left) genes in SSPC cluster between different experimental groups. g Dotplot showing SASP (senescence-associated secretory phenotype)/cellular stress-related gene expression in all cells between different experimental groups. h Dotplot showing pro-endothelial and oxidative stress-related gene expression between different experimental groups.
Fig. 4
Fig. 4. Basigin overexpression alters human skeletal lineage dynamics that impair endothelial function.
a Single cell transcriptomic analysis of tissue grafts from mouse SSCs either exposed to placebo, GC, human PTH or GC+human PTH (hPTH 1-34) displayed as UMAP showing high expression of Basigin in SSPCs. SSPCs, skeletal stem and progenitor cells. Left bottom: Violin plot showing increased expression of Bsg in GC group across all cells. b Representative image of tube formation assay by VeraVec endothelial cells exposed to control supernatant or supernatant of human SSCs overexpressing Basigin. c Quantification of ImageJ-based tube formation analysis. n = 6 independent samples from two independent experiments. d Representative brightfield images of the endothelial scratch assay (left) and its quantification (right). n = 6 independent samples from three independent experiments. e Measurement of reactive oxygen species in cultured endothelial cells after 24 h supernatant exposure. Left: representative fluorescence images. Right: Quantification of fluorescence signal. n = 6. All experiments with supernatant from at least two donors and two independent experiments. f Colony-forming unit ability of primary human SSCs either overexpressing control vector or Basigin. CFU-Fs stained by Crystal violet. n = 6 independent replicates from cells of two biologically independent donors. g In vitro osteogenesis (Alizarin Red S stain) by hSSCs of the same groups. n = 3 independent replicates from cells of one biological donor. h In vitro chondrogenesis (Alcian Blue stain) assays of the same groups. n = 6 independent replicates from cells of two biologically independent donors. i Schematic of subcutaneous transplant approach. Created in BioRender. Ambrosi, T. (2025) https://BioRender.com/4wl26h3. j Immunohistochemistry of Basigin (green) expression in SSC-generated grafts with corresponding quantification. n = 3 biologically independent donor cells in three biologically independent mice per group. k Representative Alizarin Red S staining of sectioned grafts and quantification of mineralized tissue in grafts containing transplanted human SSCs as assessed by Alizarin Red S staining. n = 6 sections from three biologically independent grafts. l Representative TRAP staining of sectioned grafts and quantification of TRAP-positive area of grafts. n = 6 sections from three biologically independent grafts. m Representative immunohistochemistry staining for Endomucin and DAPI of sectioned graft. Small insert shows Endomucin staining without DAPI. All data shown as mean ± SEM. Statistical testing between Placebo and other groups by two-sided unpaired Student’s t-test. *p < 0.05, **p < 0.01 ***p < 0.001, ****p < 0.0001. Scale bars, 50 µm.
Fig. 5
Fig. 5. Antibody blockade of Basigin rescues GC-induced endothelial and skeletal impairments in vitro.
a Tube formation assay of human VeraVec endothelial cells treated with supernatant from different experimental groups. n = 6 independent replicates per group from two independent experiments. b Representative brightfield images of endothelial scratch assay (top) and its quantification displayed as boxplots (bottom) after 12 h. Endothelial cells were treated with supernatant of cultured hSSCs treated as shown. n = 6 independent replicates from two independent experiments for Ctrl+aBsg and Bsg-OE+aBsg groups. n = 12 independent replicates from three independent experiments for Bsg-OE group. Boxplots with box and whiskers Min to Max. c In vitro osteogenesis of patient-derived human SSCs. Left: Boxplots showing quantification of Alizarin Red S staining. Right: Representative images of Alizarin Red S staining. Ctrl: control media only; Ctrl+PTH: control media with PTH 1-34 treatment 6 h before media change; Ctrl+aBsg: control media with Basigin antibody treatment. Bsg-OE: Lentivirally Basigin-overexpressing human SSCs with control media. n = 10 independent replicates of cells from two independent donors. Data shown as mean ± SEM. Statistical testing in a,c by one-way ANOVA with Fisher-LSD test, in b by Wilcoxon signed-rank test. *p < 0.05, **p < 0.01 ***p < 0.001, ****p < 0.0001. Scale bars, 100 µm.
Fig. 6
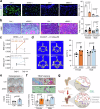
Fig. 6. Pharmacological blockade and genetic knockout of Basigin reverses GC-induced skeletal changes.
a Schematic of experimental setup. Created with BioRender.com. b Representative immunohistochemistry images and quantification of Basigin expression in the different experimental groups. n = 3 biologically independent mice per group. c Representative H&E stain of distal femurs of experimental groups with quantification of trabecular bone area below the growth plate region. n = 5 biologically independent mice per group. d TRAP staining and quantification of femur bones from all experimental groups. n = 3 biologically independent mice per group. e Representative images of Endomucin-positive endothelium in the bone marrow environment. Arrows: small sinusoids. f Flow cytometric analysis of femur bones of experimental groups for skeletal stem cells (SSCs). n = 5 biologically independent mice per group. g In vitro osteogenic differentiation of bone marrow stromal cells derived from experimental groups stained with Alizarin Red. n = 3 biologically independent mice per group. h Flow cytometric analysis of blood from mice of different experimental groups showing lymphoid to myeloid ratio. i Flow cytometric analysis of bone marrow (BM) common myeloid progenitor cells (CMPs) from mice of different experimental groups. n = 5 biologically independent mice per group. j Experimental schematic for GC experiments in heterozygous Basigin knockout mice. Control (Ctrl) and tamoxifen-treated conditional knockout (cKO) mice were compared for their skeletal response to GC exposure. Created in BioRender. Ambrosi, T. (2025) https://BioRender.com/35tbvy1. k Co-staining of Basigin (green) and endothelial marker CD31 (red) in bones of experimental groups after GC exposure. l Micro-CT analysis of trabecular bone parameters at endpoint. n = 3 mice per group. m TRAP staining for osteoclast activity at endpoint. Average from n = 3 biologically independent mice per group. All data shown as mean ± SEM. Statistical testing by one-way ANOVA with Fisher-LSD test for pharmacological approach (bi) or by two-sided unpaired Student’s t-test for comparison of genetic knockout groups (km). *p < 0.05, **p < 0.01, ***p < 0.001, ****p < 0.0001. Scale bars, 50 µm.
Fig. 7
Fig. 7. Antibody blockade of Basigin in aging mice reinvigorates skeletal remodeling improving bone mass.
a IHC of Basigin expression in tibias of 24-month-old mice. Right: Histology-based quantification Basigin-expression cells per analyzed area. n = 3 biologically independent mice per sex and group. b H&E staining of proximal tibia regions below the growth plate. Right: Histology-based quantification of tibial trabecular BV/TV. n = 12 biologically independent female mice per group. n = 9 biologically independent male mice per group. c DEXA bone mineral density (BMD) measurements of vertebral L5 at treatment starting day-0 and at day-14 of treatment. d Micro-CT measurement of vertebral L5 BV/TV at 4 weeks of treatment. n = 5 biologically independent mice per sex and group. e Representative Alizarin Red S staining of in vitro osteogenesis. Cells from n = 5 independent mice per group. f TRAP quantification in tibia sections of experimental groups. N.Oc/BS: number of osteoclasts per bone surface. Analysis of n = 4 biologically independent female mice per group. n = 3 biologically independent male mice per group. g Graphical summary of experimental findings. Created in BioRender. Ambrosi, T. (2025) https://BioRender.com/03daips. All data shown as mean ± SEM. Statistical testing between IgG control and other group by two-sided unpaired Student’s t-test. *p < 0.05, **p < 0.01, ***p < 0.001, ****p < 0.0001. Scale bars, 50 µm.

Similar articles

References

    1. Lane, N. E. Glucocorticoid induced osteoporosis: new insights into the pathophysiology and treatments. Curr. Osteoporos. Rep.17, 1–7 (2019). - PMC - PubMed
    1. Lane, N. E. et al. Prevalence of glucocorticoid induced osteonecrosis in the mouse is not affected by treatments that maintain bone vascularity. Bone Rep.9, 181–187 (2018). - PMC - PubMed
    1. Chang, C., Greenspan, A. & Gershwin, M. E. The pathogenesis, diagnosis and clinical manifestations of steroid-induced osteonecrosis. J. Autoimmun.110, 102460 (2020). - PubMed
    1. van Staa, T. P., Leufkens, H. G. M. & Cooper, C. The epidemiology of corticosteroid-induced osteoporosis: a meta-analysis. Osteoporos. Int.13, 777–787 (2002). - PubMed
    1. Lane, N. E. et al. Parathyroid hormone treatment can reverse corticosteroid-induced osteoporosis. Results of a randomized controlled clinical trial. J. Clin. Invest.102, 1627–1633 (1998). - PMC - PubMed

MeSH terms

Substances