. 2025 Aug 15;16(1):7617.
doi: 10.1038/s41467-025-62655-4.

A chronic Acinetobacter baumannii pneumonia model to study long-term virulence factors, antibiotic treatments, and polymicrobial infections

Affiliations

A chronic Acinetobacter baumannii pneumonia model to study long-term virulence factors, antibiotic treatments, and polymicrobial infections

Clay D Jackson-Litteken et al. Nat Commun. .

Abstract

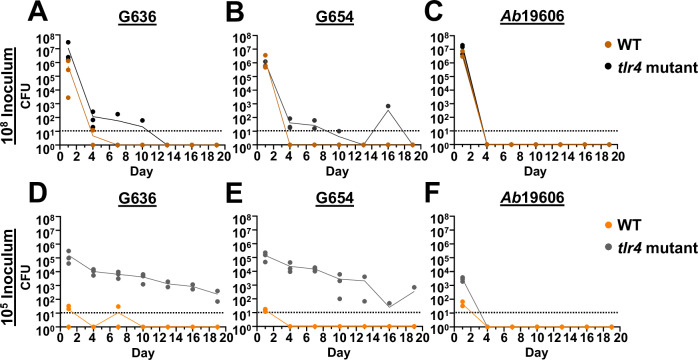
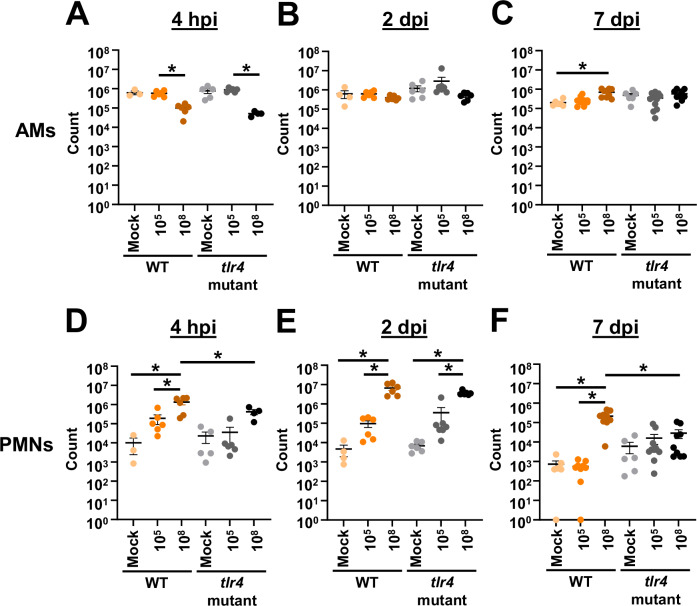
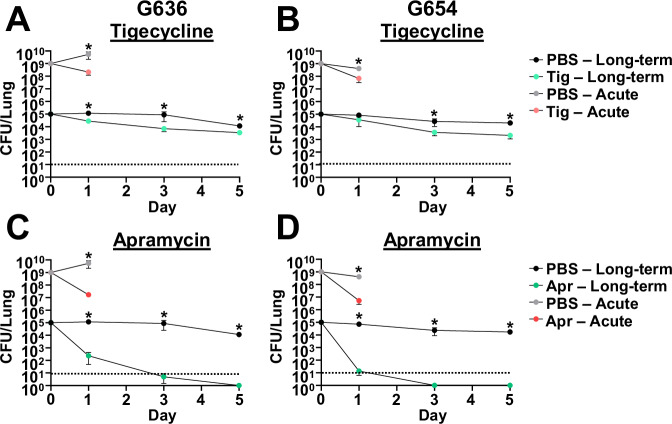
Acinetobacter baumannii causes prolonged infections that disproportionately affect immunocompromised populations. Our understanding of A. baumannii respiratory pathogenesis relies on an acute murine infection model with limited clinical relevance that employs an unnaturally high number of bacteria and requires assessment of bacterial load at 24-36 h post-infection. Here, we demonstrate that low intranasal inoculums in tlr4 mutant mice allows for infections lasting at least 3 weeks. Using this "chronic infection model" we determine the adhesin InvL is a virulence factor required during later stages of infection, despite being dispensable in the early phase. We also demonstrate that the chronic model enables distinction between antibiotics that, although initially reduce bacterial burden, either lead to clearance or result in the formation of potential bacterial persisters. To illustrate how our model can be applied to study polymicrobial infections, we inoculate mice with an active A. baumannii infection with Staphylococcus aureus or Klebsiella pneumoniae. We find that S. aureus exacerbates infection, while K. pneumoniae enhances A. baumannii clearance. In all, the chronic model overcomes some limitations of the acute pulmonary model, expanding our capabilities to study A. baumannii pathogenesis and lays the groundwork for the development of similar models for other opportunistic pathogens.


Conflict of interest statement

Competing interests: The authors declare no competing interests.

Figures

Fig. 1
Fig. 1. Low inoculums of modern respiratory A. baumannii clinical isolates result in chronic lung infection in tlr4 mutant mice.
Groups of female C3H/HeN (WT) or C3H/HeJ (tlr4 mutant) mice were intranasally inoculated with 108 G636 (A), 108 G654 (B), 108 Ab19606 (C), 105 G636 (D), 105 G654 (E), or 105 Ab19606 (F). Beginning at 24 hpi, groups of mice were sacrificed every 3 days, and bacteria in the lungs were quantified. Each data point indicates an individual mouse, and the connecting line intersects each timepoint at the mean. The limit of detection (10 CFU) is indicated by the dashed line. Source data are provided as a Source Data file.
Fig. 2
Fig. 2. Lower intranasal A. baumannii inoculums result in reduced lung neutrophil influx.
Groups of female C3H/HeN (WT) or C3H/HeJ (tlr4 mutant) mice were intranasally inoculated with 105 G636, 108 G636, or mock inoculated with PBS. At 4 h (A, D), 2 d (B, E), and 7 d (C, F) pi, alveolar macrophages (AMs) (AC) and polymorphonuclear leukocytes (PMNs) (DF) in the BALF were enumerated by flow cytometry. Shown are pooled results from at least two independent experiments, and each data point represents an individual mouse. The horizontal line represents the mean, and the standard error of the mean (SEM) is indicated by error bars. *p < 0.05; two-way analysis of variance (ANOVA), Tukey’s test for multiple comparisons. Shown are statistically different significances between different strains at the same inoculum and between different inoculums given to the same strain. Source data and statistical test details are provided in the Source Data file. p values: 4 hpi AMs WT, 105 vs. Mock = 0.0242; 4 hpi AMs tlr4 mutant 105 vs. 108 = 0.0003; 7 dpi AMs, WT Mock vs. 108 = 0.0272; 4 hpi PMNs, WT Mock vs. 108 = 0.0037; 4 hpi PMNs, WT 105 vs. 108 = 0.0020; 4 hpi PMNs, WT 108 vs. tlr4 mutant 108 = 0.0402; 2 dpi PMNs, WT Mock vs. 108 = < 0.0001; 2 dpi PMNs, WT 105 vs. 108 = < 0.0001; 2 dpi PMNs, tlr4 mutant Mock vs. 108 = 0.0190; 2 dpi PMNs, tlr4 mutant 105 vs. 108 = 0.0313; 7 dpi PMNs, WT Mock vs. 108 = < 0.0001; 7 dpi PMNs, WT 105 vs. 108 = < 0.0001; 7 dpi PMNs, WT 108 vs. tlr4 mutant 108 = < 0.0001.
Fig. 3
Fig. 3. The chronic respiratory infection model results in lung pathology.
Groups of female C3H/HeJ (tlr4 mutant) mice were inoculated with 105 G636 or mock-inoculated with PBS, and at 4 hpi, 2 dpi, 7 dpi, 14 dpi, and 21 dpi, lungs slices were prepared, H&E stained, and scored for alveolitis (A) or airway epithelium attenuation (B). Shown are three biological replicates with 2/3 mice/replicate (n = 6–7). The bar represents the mean, each mouse is indicated by a dot, and the SEM is indicated by error bars. *p < 0.05; two-way ANOVA, Bonferroni’s test for multiple comparisons. Representative tissue sections of mock-infected tissue (C) and alveolitis (D) and attenuated airway epithelium (E) in infected tissue are shown. Scale bars = 500 µm and inset scale bars = 200 µm.
Fig. 4
Fig. 4. InvL is a critical virulence factor for long-term respiratory infection, but dispensable in the acute infection model.
Female C3H/HeJ (tlr4 mutant) mice were infected with 105 G636, G636 ΔinvL, or G636 invL+. Groups of mice were then sacrificed at 1 dpi (A), 7 dpi (B), 14 dpi (C), and 21 dpi (D), and CFU in the lungs were quantified. Shown are the pooled results from three independent experiments. For the acute infection model, groups of female C57BL/6 mice were infected with 109 G636, G636 ΔinvL, or G636 invL+. 24 hpi, mice were sacrificed, and CFU in the lungs (E), spleen (F), and kidneys (G) were enumerated. Shown are the pooled results of two independent experiments. Each data point represents an individual mouse, the horizontal line represents the mean, and the SEM is indicated by error bars. The limit of detection (10 CFU) is indicated by the dashed line. *p < 0.05; Kruskal–Wallis H test with Dunn’s test for multiple comparisons; ns not significant. Source data and statistical test details are provided in the Source Data file.
Fig. 5
Fig. 5. The chronic respiratory infection model can be used to study outcomes of antibiotic treatment.
Groups of female C3H/HeJ (tlr4 mutant) mice were infected with 105 G636 (A, C) or 105 G654 (B, D) and sacrificed at 1, 3, and 5 dpi (long-term). Additionally, groups of female C57Bl/6 mice were infected with 109 G636 (A, C) or 109 G654 (B, D) and sacrificed at 24 hpi (acute). Mice in both infection models were treated intraperitoneally with PBS or 100 mg/kg tigecycline (tig) every 12 h (A, B) or PBS or 500 mg/kg apramycin (apr) every 12 h (C, D) with all treatments beginning 4 hpi. At each timepoint, CFU were quantified in the lungs. Shown are the pooled results from two independent experiments, each data point represents the mean, and the SEM is represented by error bars. The limit of detection (10 CFU) is indicated by the dashed line. *p < 0.05; two-tailed Mann–Whitney U test. Source data and statistical test details are provided in the Source Data file.
Fig. 6
Fig. 6. Bacterial secondary infection alters the course of chronic A. baumannii pneumonia.
Female C3H/HeJ (tlr4 mutant) mice were intranasally inoculated with 105 G636, and groups of mice were sacrificed at 1, 7, and 14 dpi. At 14 days post-A. baumannii infection, groups of mice were either not inoculated (untreated), inoculated with PBS (mock-infected), infected with S. aureus, or infected with K. pneumoniae. Subsequently, on days 15 and 16 post-A. baumannii infection (1 and 2 days post-secondary infection), mice were sacrificed, and A. baumannii CFU were quantified in the lungs (A, D, E), spleen (B), and kidneys (C). In AC, each data point represents the mean, the SEM is represented by error bars, and the limit of detection (10 CFU) is indicated by the dashed line. In D and E, each data point represents an individual mouse, the horizontal line represents the mean, and the SEM is indicated by error bars. Shown are the pooled results from at least two independent experiments. *p < 0.05; Kruskal–Wallis H test with Dunn’s test for multiple comparisons. The limit of detection (10 CFU) is indicated by the dashed line. Source data and statistical test details are provided in the Source Data file.

Update of

References

    1. Vijayakumar, S., Biswas, I. & Veeraraghavan, B. Accurate identification of clinically important Acinetobacter spp.: an update. Future Sci. OA5, FSO395 (2019). - PMC - PubMed
    1. Cerqueira, G. M. & Peleg, A. Y. Insights into Acinetobacter baumannii pathogenicity. IUBMB Life63, 1055–1060 (2011). - PubMed
    1. Sarshar, M., Behzadi, P., Scribano, D., Palamara, A. T. & Ambrosi, C. Acinetobacter baumannii: an ancient commensal with weapons of a pathogen. Pathogens10, 387 (2021). - PMC - PubMed
    1. Di Venanzio, G. et al. Urinary tract colonization is enhanced by a plasmid that regulates uropathogenic Acinetobacter baumannii chromosomal genes. Nat. Commun.10, 2763 (2019). - PMC - PubMed
    1. Murray, C. J. et al. Global burden of bacterial antimicrobial resistance in 2019: a systematic analysis. Lancet399, 629–655 (2022). - PMC - PubMed

MeSH terms

LinkOut - more resources