. 2025 Aug 15;16(1):7611.
doi: 10.1038/s41467-025-62951-z.

Androgens drive SLC1A5-dependent metabolic reprogramming in polycystic ovary syndrome

Affiliations

Androgens drive SLC1A5-dependent metabolic reprogramming in polycystic ovary syndrome

Yishu Wang et al. Nat Commun. .

Abstract

Polycystic ovary syndrome is the primary cause of female infertility. Growing evidence suggests that dysregulation of amino acid metabolism plays a significant role in the onset and progression. However, the underlying mechanism remains unclear. In this study, we conduct targeted metabolite profiling of human follicular fluid and granulosa cells. A significant increase in glutamine uptake is observed in patients with hyperandrogenic polycystic ovary syndrome, mediated by the upregulation of SLC1A5, a specific glutamine transporter. We find that androgen excess primarily activates SLC1A5 expression. Furthermore, SLC1A5 overexpression in female mice induces polycystic ovary syndrome-like phenotypes, including hyperandrogenism and abnormal follicle development. Additionally, the pharmacological blockade of SLC1A5 provides reproductive benefits to mice exhibiting polycystic ovary syndrome-like symptoms. Mechanistically, we show that elevated flux of Gln-derived α-ketoglutarate enhances HDAC5 expression and suppresses acetylation on histone 3 lysine residue 14 and lysine residue 56. The reduction in acetylation level is associated with the downregulation of several genes related to folliculogenesis, including CYP19A1, thereby exacerbating androgenic homeostasis imbalance. These findings indicate that androgen-induced aberrant glutamine uptake via SLC1A5 is crucial for the development and progression of polycystic ovary syndrome, suggesting pharmacological blockade of SLC1A5 as a potential therapeutic strategy.


Conflict of interest statement

Competing interests: The authors declare no competing interests.

Figures

Fig. 1
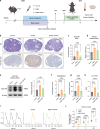
Fig. 1. The Gln uptake increases in GCs of HA-PCOS patients and the ovaries of PCOS-like mice.
a, b Targeted metabolomic profile on FF (a) and GCs (b) of clinical patients. The FF samples were collected from Control (n = 22), NA-PCOS (n = 21), and HA-PCOS (n = 22), and the GC samples were collected from Control (n = 14), NA-PCOS (n = 13), and HA-PCOS (n = 13). c, d Correlation of Gln levels in FF (c) and GCs (d) with the levels of hormones, as determined by Spearman’s rank test. *p < 0.05, ***p < 0.001. e, f The correlation of the residuals of Gln levels in FF (e) and GCs (f) with the residuals of TT levels, adjusted for age and BMI. g Targeted metabolomic profile on DHT-treated KGN cells (10-7 mol/L, 24 h, n = 6). h Gln uptake ratio of KGN cells treated with DHT, FSH, and Estradiol (10-7 mol/L, 24 h, n = 6 for each group). i Workflow of DHEA-induced PCOS-like model. Created in BioRender. Ye, L. (2025) https://BioRender.com/yb2yu8f. j Gln levels in murine ovaries (Control n = 17, DHEA n = 21). k Representative images of hematoxylin and eosin (HE) staining and MALDI mass spectrometry imaging of Gln on murine ovaries (scale bar: 400 μm). The experiment was repeated three times independently with similar results. For statistical analysis, one-way ANOVA followed by Tukey’s multiple comparisons tests, Welch’s ANOVA followed by Dunnett’s T3 multiple comparisons tests, and Kruskal-Wallis tests followed by Dunn’s multiple comparisons tests were performed in (a, b, h); linear regression analyses were performed in (e, f); Student’s t tests and Mann-Whitney tests were performed in (g, j). Data are presented as the mean ± SEM. All tests were two-sided. Source data are provided as a Source Data file.
Fig. 2
Fig. 2. The SLC1A5-dependent Gln uptake is induced by androgen.
a The overlapping DEGs of GCs by RNA-seq analysis (n = 6 for each group). b GSEA analysis in GCs of HA-PCOS compared with Control. c qPCR was performed to assess the expression levels of SLC1A5 in Control (n = 24) and HA-PCOS (n = 23). d IF staining was performed to visualize the expression of SLC1A5 in human GCs (scale bar: 50 µm). The experiment was repeated three times independently with similar results. e WB and densitometric analysis of SLC1A5 expression in human GCs from Control and HA-PCOS (n = 5 for each group). β-Actin was denoted as an internal reference protein. f Gln uptake ratio of OE-SLC1A5 KGN cells (Control n = 4, OE-SLC1A5 n = 3). g Targeted metabolomic profile on SLC1A5-overexpressed KGN cells (n = 6). h, i qPCR (h) and WB analysis (i) of SLC1A5 expression in KGN cells treated with different doses of DHT for 2 h (n = 3 for each group). j Stacc-seq analysis was performed to identify binding peaks of AR in HEK293T cells. The Stacc-seq data were visualized using IGV. Peaks were identified as regions of significant enrichment on the promoter region of SLC1A5 (indicated by yellow) and correspond to the binding sites of AR. The plasmids were transfected into HEK293T for 24 h, followed by DHT treatment (10-7 mol/L) for another 24 h (n = 2). For statistical analysis, GSEA of selected GO-BP terms was performed using the R package clusterProfiler (v4.16.0) in (b); Mann-Whitney test was performed in (c); Student’s t tests were performed in (eg); Kruskal-Wallis tests with Dunn’s tests were performed in (h); one-way ANOVA followed by Dunnett’s tests were performed in (i). Data are presented as the mean ± SEM. All tests were two-sided. Source data are provided as a Source Data file.
Fig. 3
Fig. 3. SLC1A5 overexpression in mouse ovaries induces PCOS-like traits and impairs follicle development.
a Schematic diagram of mouse ovarian orthotopic injection surgery. Created in BioRender. Ye, L. (2025) https://BioRender.com/bpgxwa4/. b Estrous cycle monitoring in AAV-Control and AAV-Slc1a5 mice was conducted over 2 weeks using vaginal cytology (n = 6 for each group). P, proestrus; E, estrus; M/D, metestrus/diestrus phase. c Representative images of ovarian HE staining and immunohistochemistry (IHC) staining of SLC1A5 showing follicular development in AAV-Control and AAV-Slc1a5 mice (scale bar: 500 μm and 100μm). The experiment was repeated three times independently with similar results. d Follicle number of primordial (PrF), primary (PF), secondary (SF), antral follicles (AF), and corpus luteum (CL) in HE-stained ovarian sections of AAV-Control and AAV-Slc1a5 mice (n = 5 for each group). e Serum levels of TT measured using LC-MS (n = 10 for each group). f Serum AMH levels measured using ELISA (n = 10 for each group). g Serum LH/FSH ratio measured using ELISA (AAV-Control n = 11, AAV-Slc1a5 n = 7). h Fertility index calculated through reproductive experiments (n = 5 for each group). i Number of oocytes counted after superovulation (n = 5 for each group). Statistical analyses were performed using the Student’s t test or the Mann-Whitney test in (b, d, e–i). Data are presented as the mean ± SEM. All tests were two-sided. The biological replicates are used for statistical analysis in (b, d, e–i). Source data are provided as a Source Data file.
Fig. 4
Fig. 4. SLC1A5 inhibitor, GPNA, confers reproductive benefits to PCOS-like mice.
a Schematic diagram of PCOS-like mouse modeling and tissue collection. Created in BioRender. Ye, L. (2025) https://BioRender.com/z45m452. b Representative images of ovarian HE staining and IHC staining of SLC1A5 showing follicular development in Control, DHEA, and DHEA + GPNA mice (scale bar: 200 μm). The experiment was repeated three times independently with similar results. c Percentage of SLC1A5 positive area determined by IHC (n = 6 for each group). d mRNA expression of Slc1a5 in the mouse GCs determined by qPCR (n = 3 for each group). e Western blot analysis of SLC1A5 in mouse GCs (n = 3 for each group). β-Actin was denoted as an internal reference protein. f Serum levels of TT measured using LC-MS (n = 10 for each group). g Serum levels of AMH measured using ELISA (Control n = 6, DHEA n = 5, DHEA + GPNA n = 6). h Serum levels of LH/FSH ratio measured using ELISA (n = 6 for each group). i, j Estrous cycle monitoring conducted over 2 weeks using vaginal cytology (i) and percentage of time on cycle phase (j) in Control, DHEA and DHEA + GPNA mice was (n = 6 for each group). For statistical analysis, one-way ANOVA followed by Tukey’s multiple comparisons test or Kruskal-Wallis test with Dunn’s test was utilized. Data are presented as the mean ± SEM. All tests were two-sided. The biological replicates are used for statistical analysis in (c–h, j). Source data are provided as a Source Data file.
Fig. 5
Fig. 5. SLC1A5 mediates energy metabolism and drives α-KG accumulation.
a Cell Counting Kit-8 (CCK8) assays performed in the Control (n = 3), OE-SLC1A5 (n = 3) and OE-SLC1A5 + GPNA (n = 5) KGN cells. Orange figures denote significant differences between Control and OE-SLC1A5, and green figures denote significant differences between Control and OE-SLC1A5 + GPNA. bd GSH/GSSG ratio (b), ROS (c), and mitoROS (d) in Control, OE-SLC1A5, and OE-SLC1A5 + GPNA KGN cells (n = 6 for each group). GSH, glutathione; GSSG, oxidized glutathione; ROS, reactive oxygen species. e Transmission electron microscope (TEM) of mitochondria in Control and sh-SLC1A5 cells. (*indicates damaged mitochondria, Scale bar = 500 nm). The experiment was repeated three times independently with similar results. f Mitochondrial membrane potential (MMP) in Control (n = 3) and sh-SLC1A5 KGN (n = 5) cells measured by flow cytometry. gi GSH/GSSG ratio (g), ROS (h), and mitoROS (i) detected in Control and sh-SLC1A5 KGN cells (n = 6 for each group). j, k Extracellular acidification rates (ECARs) (j) and oxygen consumption rates (OCRs) (k) were assessed in Control, OE-SLC1A5, and OE-SLC1A5 + GPNA KGN cells (n = 3 for each group). l, m ECARs (l) and OCRs (m) were assessed in Control, sh-SLC1A5 KGN cells (n = 3). For statistical analysis, two way ANOVA followed by Tukey’s multiple comparisons tests was applied to (a); one-way ANOVA followed by Tukey’s multiple comparisons tests was performed in (b, d, j, k); Welch’s ANOVA followed by Dunnett’s T3 multiple comparisons test was performed in c; Student’s t tests were performed in (f, h, i, l, m) and a Mann-Whitney test was performed in (g). Data are presented as the mean ± SEM. All tests were two-sided. Source data are provided as a Source Data file.
Fig. 6
Fig. 6. α-KG treatment induces PCOS-like traits.
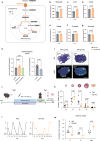
a Schematic diagram of Gln metabolism in cytoplasm and mitochondria with L-Gln (13C5, 99%) as a tracer. b–g Labeling patterns of glutamate (b), α-KG (c), citrate (d), malate (e), fumarate (f), and succinate (g) from L-Gln (13C5, 99%) in Control, OE-SLC1A5, and OE-SLC1A5 + GPNA KGN cells (n = 5 for each group). m + n represents the total fraction of a compound, where m is the natural isotope fraction and n is the number of 13C atoms. h The intracellular α-KG levels in Control, OE-SLC1A5, OE-SLC1A5 + GPNA, and sh-SLC1A5 KGN cells (n = 5 for each group). i Representative images of HE staining and MALDI mass spectrometry imaging of α-KG on murine ovaries (scale bar: 400 μm). The experiment was repeated three times independently with similar results. j Schematic diagram of DM-αKG injection-induced mouse modeling. Created in BioRender. Ye, L. (2025) https://BioRender.com/w83x073. k Follicle number of primordial (PrF), primary (PF), secondary (SF), antral follicles (AF), and corpus luteum (CL) performed on HE-stained ovarian sections in PBS and DM-αKG mice (n = 6 for each group). l, m Estrous cycle monitoring and conducted over 2 weeks using vaginal cytology (l) and percentage of time on cycle phase (m) in PBS and DM-αKG mice (n = 5 for each group). For statistical analysis, Student’s t tests and Mann-Whitney tests were performed in (b–g, h, k, m); and one-way ANOVA followed by Tukey’s multiple comparisons test was performed in (h). Data are presented as the mean ± SEM. All tests were two-sided. Source data are provided as a Source Data file.
Fig. 7
Fig. 7. H3K14ac and H3K56ac mediate HDAC5 and α-KG action regarding CYP19A1 expression.
a Reactome pathway analysis of DEGs from RNA-seq analysis in DM-αKG-treated (5 mM, 24 h) KGN cells (n = 3). b WB of histone acetylation in mock and DM-αKG-treated KGN cells, and Control and OE-SLC1A5, with β-Actin as reference. c Volcano plot of DEGs from RNA-seq analysis in Control and OE-SLC1A5 KGN cells (n = 3), highlighting upregulated (red) and downregulated (blue) genes (|log2FC | > 1, padj < 0.05). d WB of HDAC5 expression in Control and OE-SLC1A5 KGN cells, with α-Tubulin as reference. e WB of HDAC5 expression in Mock and DM-α-KG-treated-KGN cells. α-Tubulin was denoted as an internal reference protein. f WB analysis of histone acetylation levels in Control and OE-HDAC5 KGN cells, with β-Actin as reference. g Venn diagram and heatmap comparing DEGs from RNA-seq in OE-HDAC5/Control and DM-αKG/mock KGN cells (n = 3). h CYP19A1 expression in Mock and DM-αKG-treated KGN cells by qPCR (n = 3). i CYP19A1 expression in Control, OE-SLC1A5, and OE-HDAC5 in KGN cells by qPCR (n = 3). j, k WB (j) and densitometric analysis (k) of CYP19A1 in human GCs from Control and HA-PCOS (n = 5), with GAPDH as reference. l FPKM of CYP19A1 in human GCs from Control and HA-PCOS by RNA-seq (n = 5). m CUT & Tag analysis of H3K14ac and H3K56ac binding peaks in DM-αKG-treated KGN cells, with CYP19A1 promoter (yellow) and enhancer (blue) regions highlighted. The experiment was repeated three times independently in (b, d-f, and j) with similar results. For statistical analysis, DESeq2 was used in (a, c, l), with the Benjamini-Hochberg method applied for multiple testing correction in (a, c); one-way ANOVA followed by Dunnett’s tests was performed in (h, i); and Student’s t tests were performed in (k). Data are presented as the mean ± SEM. All tests were two-sided. Source data are provided as a Source Data file.
Fig. 8
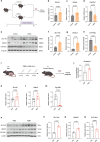
Fig. 8. The levels of SLC1A5, HDAC5, and CYP19A1 in the ovaries of DHEA-induced PCOS-like and PAMH mice.
a Schematic diagram of the DHEA-induced PCOS-like model. Created in BioRender. Ye, L. (2025) https://BioRender.com/yb2yu8f. b–d mRNA expression of Slc1a5 (b), Hdac5 (c), and Cyp19a1 (d) in ovaries collected from Control and DHEA-treated mice determined by qPCR (n = 12 for each group). eh Western blots (e) and densitometric analysis of SLC1A5 (f), HDAC5 (g), and CYP19A1 (h) expression relative to α-Tubulin in the ovaries of Control and DHEA-treated mice (n = 5 for each group). i Schematic diagram of the PAMH model. Created in BioRender. Ye, L. (2025) https://BioRender.com/0wojt74. j Levels of glutamine in the ovaries of F1 female offspring of PBS and AMH-treated (n = 5 for each group) dams. km mRNA expression of Slc1a5 (k) Hdac5 (l) and Cyp19a1(m) in the ovaries of F1 female offspring of PBS and AMH-treated dams determined by qPCR (n = 15 for each group). nq Western blots (n) and densitometric analysis of SLC1A5 (o) HDAC5 (p) and CYP19A1 (q) expression relative to β-Actin in the ovaries of PBS and AMH-treated mice (n = 5 for each group). For statistical analysis, Mann-Whitney tests were performed in (b, c, m); and Student’s t tests were performed in (d, f–h, j–l, o–q). All tests were two-sided. The biological replicates are used for statistical analysis in (b–h, j–q). Source data are provided as a Source Data file.
Fig. 9
Fig. 9. The graph model of the role of SLC1A5 in granulosa cells under physiological versus hyperandrogenic PCOS conditions.
In hyperandrogenic granulosa cells, elevated androgen levels directly enhance AR binding to the SLC1A5 promoter, driving its transcriptional activation and upregulating SLC1A5 expression. This hyperactivation enhances glutamine uptake, leading to excessive α-KG accumulation. The surplus α-KG interacts with histone deacetylase 5 (HDAC5), resulting in global hypoacetylation (reduced H3K14ac and H3K56ac). This epigenetic repression downregulates CYP19A1 and other folliculogenesis-related genes. Critically, CYP19A1 suppression disrupts the aromatase-mediated conversion of androgens to estrogens. Thus, a pathological feedforward loop is established: hyperandrogenism reinforces AR-driven SLC1A5 overexpression, which in turn exacerbates hyperandrogenism. This self-sustaining cycle perpetuates ovarian dysfunction in PCOS. Created in BioRender. Ye, L. (2025) https://BioRender.com/t27l890.

References

    1. Boyle, J. A. & Teede, H. J. Refining diagnostic features in PCOS to optimize health outcomes. Nat. Rev. Endocrinol.12, 630–631 (2016). - PubMed
    1. Unluhizarci, K., Karaca, Z. & Kelestimur, F. Role of insulin and insulin resistance in androgen excess disorders. World J. Diabetes12, 616–629 (2021). - PMC - PubMed
    1. Joham, A. E. et al. Polycystic ovary syndrome. Lancet Diabetes Endocrinol.10, 668–680 (2022). - PubMed
    1. Teede, H. J. et al. Recommendations from the 2023 international evidence-based guideline for the assessment and management of polycystic ovary syndrome. J. Clin. Endocrinol. Metab.108, 2447–2469 (2023). - PMC - PubMed
    1. Escobar-Morreale, H. F. Polycystic ovary syndrome: Definition, aetiology, diagnosis and treatment. Nat. Rev. Endocrinol.14, 270–284 (2018). - PubMed

MeSH terms

LinkOut - more resources