

Autofluorescence properties of wound-associated bacteria cultured under various temperature, salinity, and pH conditions
- PMID: 40817211
- PMCID: PMC12355787
- DOI: 10.1186/s12866-025-04200-3
Autofluorescence properties of wound-associated bacteria cultured under various temperature, salinity, and pH conditions
Abstract
Background: Bacterial autofluorescence plays a vital role in photodiagnosis (PD) and antimicrobial photodynamic therapy (aPDT), yet the autofluorescence properties of wound-associated bacteria and their responses to the physicochemical microenvironment, remain underexplored. Here, we investigated the bacterial autofluorescence of Acinetobacter baumannii, Escherichia coli, Klebsiella pneumoniae, and Staphylococcus aureus under various culture conditions, including different temperatures, NaCl concentrations, and pH levels found within wounds. Fluorescence imaging was employed to quantify red fluorescence intensity, while fluorescence spectrometry was used to correlate the observed fluorescence with spectral profiles, benchmarking them against coproporphyrin and protoporphyrin IX.
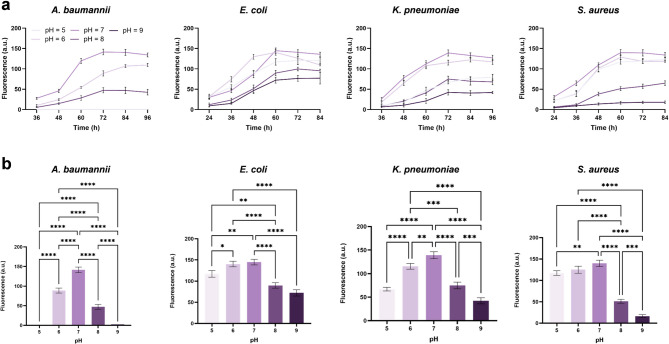
Results: Our results revealed that the selected bacteria emitted red fluorescence in vitro, consistent with their known porphyrin biosynthesis capabilities. The intensity of red fluorescence was primarily dependent on the bacterial species, growth phase, and culture conditions. Elevated culture temperature accelerated the fluorescence metabolism, whereas increasing NaCl concentrations and alkaline pH levels inhibited red fluorescence in a dose-dependent manner. Linear regression revealed a strong positive correlation between red fluorescence intensity and peak fluorescence emission when excited at 405 nm. The biosynthesis of endogenous porphyrins varied both across and within bacterial species, with distinct porphyrins produced under specific conditions. The emission spectra of the gram-positive S. aureus consistently aligned with coproporphyrin, while the gram-negative A. baumannii, E. coli, and K. pneumoniae typically displayed fluorescence peaks characteristic of protoporphyrin IX. Notably, K. pneumoniae shifted to coproporphyrin with extended culture duration or more favourable conditions, and E. coli exhibited a similar transition as the pH increased to 9.
Conclusions: We concluded that the local physicochemical conditions found within wounds could affect the autofluorescence and endogenous porphyrins of the bacteria, which may, in turn, have connotations for PD and aPDT.
Keywords: Bacterial autofluorescence; Endogenous porphyrins; NaCl concentration; Temperature; pH.
© 2025. The Author(s).
Conflict of interest statement
Declarations. Ethics approval and consent to participate: Not applicable. Consent for publication: Not applicable. Competing interests: The authors declare no competing interests.
Figures


Similar articles
-
Modelling the effects of temperature, pH and osmotic shifts on the autofluorescence of Staphylococcus aureus in vitro.Future Microbiol. 2025 Apr;20(5):409-418. doi: 10.1080/17460913.2025.2476875. Epub 2025 Mar 11. Future Microbiol. 2025. PMID: 40066523
-
Prescription of Controlled Substances: Benefits and Risks.2025 Jul 6. In: StatPearls [Internet]. Treasure Island (FL): StatPearls Publishing; 2025 Jan–. 2025 Jul 6. In: StatPearls [Internet]. Treasure Island (FL): StatPearls Publishing; 2025 Jan–. PMID: 30726003 Free Books & Documents.
-
A fluorescence-based protocol to monitor bacterial antagonism.Microbiol Spectr. 2025 Aug 5;13(8):e0318324. doi: 10.1128/spectrum.03183-24. Epub 2025 Jun 12. Microbiol Spectr. 2025. PMID: 40503833 Free PMC article.
-
Topical antimicrobial agents for treating foot ulcers in people with diabetes.Cochrane Database Syst Rev. 2017 Jun 14;6(6):CD011038. doi: 10.1002/14651858.CD011038.pub2. Cochrane Database Syst Rev. 2017. PMID: 28613416 Free PMC article.
-
Adjunctive antimicrobial photodynamic therapy for treating periodontal and peri-implant diseases.Cochrane Database Syst Rev. 2024 Jul 12;7(7):CD011778. doi: 10.1002/14651858.CD011778.pub2. Cochrane Database Syst Rev. 2024. PMID: 38994711 Free PMC article.
References
-
- Kolarikova M, Hosikova B, Dilenko H, Barton-Tomankova K, Valkova L, Bajgar R, et al. Photodynamic therapy: innovative approaches for antibacterial and anticancer treatments. Med Res Rev. 2023;43(4):717–74. 10.1002/med.21935. - PubMed
-
- Vinagreiro CS, Zangirolami A, Schaberle FA, Nunes SCC, Blanco KC, Inada NM, et al. Antibacterial photodynamic inactivation of antibiotic-resistant bacteria and biofilms with nanomolar photosensitizer concentrations. ACS Infect Dis. 2020;6(6):1517–26. 10.1021/acsinfecdis.9b00379. - PubMed
-
- Kim H-E. Red fluorescence intensity as a criterion for assessing remineralization efficacy in early carious lesions. Photodiagn Photodyn. 2024;45:103963. 10.1016/j.pdpdt.2024.103963. - PubMed
-
- He Q, Sun Z, Li Y, Wang W, Wang RK. Smartphone-enabled snapshot multispectral autofluorescence imaging and its application for bacteria assessments in skin and oral cavity. Opt Lasers Eng. 2021;140:106546. 10.1016/j.optlaseng.2021.106546.
MeSH terms
Substances
Grants and funding
- HFGJKXZX-YGRH-1/Major Project from Innovation Research Institute of Engineering Medicine and Medical Equipment
- 62305348/National Natural Science Foundation of China
- YZJJ202310-TS/HFIPS Director's Fund
- WJ23CYHXM05/Wanjiang Center industrialization project
- 2023BMP11/Project of Anhui Provincial Engineering Technology Research Center for Biomedical Optical Instrument
LinkOut - more resources
Full Text Sources
