. 2025 Aug;16(4):e70041.
doi: 10.1002/jcsm.70041.

Sepsis Induces Long-Term Muscle and Mitochondrial Dysfunction due to Autophagy Disruption Amenable by Urolithin A

Affiliations

Sepsis Induces Long-Term Muscle and Mitochondrial Dysfunction due to Autophagy Disruption Amenable by Urolithin A

Alexandre Pierre et al. J Cachexia Sarcopenia Muscle. 2025 Aug.

Abstract

Background: Sepsis survivors often experience sustained muscle weakness, leading to physical disability, with no pharmacological treatments available. Despite these well-documented long-term clinical consequences, research exploring the cellular and molecular mechanisms is sorely lacking.

Methods: Bioinformatic analysis was performed in the vastus lateralis transcriptome of human ICU survivors 7 days after ICU discharge (D7), 6 months (M6) and age- and sex-matched controls. Enrichment analysis using Gene Ontology (GO) terms and Mitocarta3.0 was performed at D7 and M6 on differentially expressed genes (DEGs) and modules identified by weighted gene co-expression network analysis (WGCNA). Using a murine model of resuscitated sepsis induced by caecal slurry injection, pathways identified by the bioinformatics analysis were explored in 18- to 24-week-old sepsis-surviving (SS) mice at Day 10. Autophagy flux was investigated both in vivo and in vitro with chloroquine, a lysosomal inhibitor and urolithin A (UA), an autophagy inducer. Systemic metabolism was evaluated with indirect calorimetry, muscle phenotype with in situ and ex vivo contractility, muscle mass, myofibre cross-sectional area and typing and mitochondrial population with transmission electron microscopy (TEM), as well as mitochondrial function with high-resolution respirometry. Autophagic vacuole (AV) level was monitored using LC3B-II and P62 protein expression and TEM.

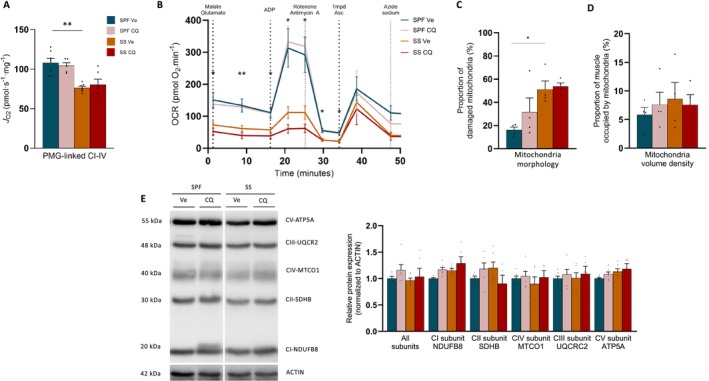
Results: Pathways related to 'mitochondrion' were the only ones whose deregulation persisted between D7 and M6 (p < 0.05) and characterized WGCNA modules correlated with muscle mass, strength and physical function. Shared mitochondrial DEGs between D7 and M6 encoded matrix mitochondrial proteins related to 'metabolism' and 'mitochondrial dynamics'. SS mice exhibited reduced complex I-driven oxygen consumption (CI-JO2) (-45%), increased S-nitrosylation of complex I, damaged (+35%) and oxidized (+51%) mitochondria and AV accumulation (5 vs. 50 AVs/mm2) compared with sham pair-fed mice (p < 0.05) despite no differences in mitochondrial size or number. Autophagy flux was reduced in SS mice due to decreased AV degradation ratio (p < 0.05). UA restored a balanced autophagy flux (turnover ratio 0.96 vs. -0.17) by increasing AVs formation and degradation ratio (p < 0.05). UA also improved CI-JO2 (81 vs. 106 pmol/s/mg), tetanic force (215 vs. 244 mN/mm2) and hindlimb muscle weight in SS mice (p < 0.05).

Conclusion: Mitochondrial and autophagy disruption contributes to long-term muscle dysfunction in human and mouse sepsis survivors. We demonstrate for the first time that sepsis induces an autophagy flux blockade. Urolithin A prevents mitochondrial and muscle impairments both in vivo and in vitro by improving autophagy flux.

Keywords: autophagy; mitochondria; muscle; sepsis.


Conflict of interest statement

The authors declare no conflicts of interest.

Figures

FIGURE 1
FIGURE 1
Sustained dysregulation of mitochondria‐related genes over time in human ICU survivors. (A) Schematic representation of the Dos Santos et al. study design: ICU survivors 7 days (D7, n = 14) and 6 months (M6, n = 10) after ICU discharge and age‐ and sex‐matched healthy volunteers (CTRL, n = 8) underwent muscle biopsy of the vastus lateralis. Created with BioRender. (B) Venn diagram representing the down‐regulated (left) and up‐regulated genes (right) in D7 versus CTRL and M6 versus CTRL contrasts. (C) Dot plot representing all the enriched GO pathways shared between down‐regulated genes for D7 versus CTRL (left) and M6 versus CTRL (right) contrasts. Dots indicate the GO category of the pathway and the gradient colour the adjusted p value of the enrichment. The principal pathways are in bold font and the sub‐pathways in non‐bold font. (D) Dot plot representing the enriched MitoCarta3.0 pathways shared between D7 and CTRL (left) and M6 and. CTRL (right) contrasts. All the principal mito‐pathways are shown in bold font. Only the top 5 sub mito‐pathways are shown in non‐bold font, representing the shared pathways between the two contrasts. Enrichments over down‐regulated genes are shown on the left side of the vertical solid line, whereas enrichments over up‐regulated genes are shown on the right side. (E) Gene expression heatmap of the common mitochondrial‐related DEGs in D7 versus CTRL and M6 versus CTRL contrasts, clustered over rows and columns according to gene expression. Additional annotations on genes (GO and MitoCarta3.0) and samples (age, sex and group) are displayed. Annotations of principal mito‐pathways and mitochondrial compartment localization according to Human MitoCarta3.0 are represented in green and purple colour gradients, respectively. BP, biological process; CC, cellular component; GO, Gene Ontology.
FIGURE 2
FIGURE 2
Mitochondrial dysfunction involves fatty acid and carbohydrate oxidation. (A) Design of the study: mice were subjected to intra‐peritoneal (i.p.) injection of 400 μL caecal slurry solution (100 mg/mL) (sepsis) or 10% PBS–glycerol solution (sham fed [SF] and sham pair‐fed [SPF]) at H0 and were resuscitated at H12. SF and Sepsis mice were fed ad libitum, and SPF mice received the same amount of food as the sepsis‐surviving (SS) mice. Muscles were harvested at D10. (B) Kaplan–Meier survival curve for SF mice (n = 18), SPF mice (n = 15), sepsis mice (n = 39). (C) In situ contractility: fatigability curve of soleus during 120 s stimulation at 40 Hz (n = 6–8 for each group). (D) Representative images of soleus myofibre types with Type I (red), Type IIa (green) or Type IIx (dark) myofibre. SF (left), SPF (middle), SS (right). Scale bars, 100 μm. Soleus global cross‐sectional area (CSA) (left), fibre type‐specific CSA (middle) and Myhc‐type proportions (right) (n = 4–5 for each group). (E) Representative respirometry profiles of soleus permeabilized muscle fibres (pmf) in SF mice (light blue curve), SPF mice (dark blue curve) and SS mice (orange curve). Oxygen consumption (JO2) recorded after sequential injections: pyruvate (5 mM), malate (2 mM) and glutamate (10 mM) (PMG); ADP (5 mM) (CI–IV for oxidative phosphorylation (OXPHOS) state driven by complex I); rotenone (Rot, 0.5 μM) and succinate (Suc, 10 mM) (CII–IV for OXPHOS state driven by complex II); antimycin A (Ama, 2.5 μM), ascorbate (Asc, 2 mM) and TMPD (0.5 mM) (CIV for OXPHOS state driven by CIV). PMG‐linked soleus pmf JO2 (n = 7–14 for each group). The respiratory control ratio (RCR) is plotted on the right Y‐axis in each graph. (F) Soleus pmf JO2 recorded after sequential injections: octanoyl‐carnitine (0.5 mM) and malate (2 mM) (Oct‐M) and then ADP (5 mM) (CI–IV) (n = 7–13 for each group). non‐SS, non‐surviving sepsis mice in dotted orange; SF, sham mice fed ad libitum in light blue; SPF, sham pair‐fed mice in dark blue; SS, sepsis‐surviving mice in orange. Each symbol represents one animal (panel E: male in blue and female in purple). Data expressed as means with SEM. Statistical comparison between SPF and SF (#) and SS and SPF (*), no comparison for the non‐SS group. Data analysed with log‐rank test (B), two‐way ANOVA test (C), one‐way ANOVA with post hoc Fisher's LSD test (E,F), Kruskal Wallis test with post hoc Dunn's test (D). *p < 0.05, **p < 0.01, ***p < 0.001, ****p < 0.0001.
FIGURE 3
FIGURE 3
Mitochondrial biomass is retained. (A) Mitochondrial DNA (mt DNA) content measured by relative Nd1 and Nd2 mt DNA expression normalized to nuclear Ppia in quadriceps (n = 5 for each group). (B) Protein expression of respiratory chain subunits (n = 5 for each group). (C) Representative low‐magnification electron micrographs (left). Scale bars: 2000 nm. Quantification of mitochondrial mass by TEM: mitochondria number, area, perimeter in tibialis anterior (n = 4 for each group) (right). (D) Heatmap of gene expression illustrating hierarchical clustering of 15 regulators of mitochondrial biogenesis in quadriceps of ICU survivors 7 days (D7, n = 14), 6 months (M6, n = 10) after ICU discharge and healthy volunteers (control, n = 8). Experimental groups are colour‐coded above the heatmap: control in grey, D7 in purple and M6 in pink. Rows (genes) and columns (samples) are clustered according to expression values, represented by a colour gradient. Additional annotations on samples (age and sex) are displayed. (E) Boxplots representing gene expression of four master regulators (PPARGC1A, TFAM, SIRT1 and NRF1) of the biogenesis transcriptional program in D7 (purple) and M6 (pink) versus control (grey). Boxes indicate medians and interquartile ranges. (F) mRNA changes of four master regulators of the biogenesis transcriptional program for SPF mice (n = 5) and SS mice (n = 9). Murine study: SPF, sham pair‐fed mice in dark blue; SS, sepsis‐surviving mice in orange. Each symbol represents one animal, and data are expressed as mean values with SEM. Data analysed by Mann–Whitney test. *p < 0.05, **p < 0.01.
FIGURE 4
FIGURE 4
Mitochondria are damaged and oxidized. A, Representative micrographs illustrating intact mitochondria in SPF mice (M) (left), accumulation of damaged (#) and empty mitochondrial ($) (middle and right), lysosome (L) in tibialis anterior. Scale bars: 500 nm. Quantification of mitochondrial damage (n = 4 for each group). (B) Mt. DNA oxidation in soleus. Representative 3D images of nuclei, mitochondria and oxidized DNA staining respectively by DAPI (blue), VDAC (red) and 8‐oxoG (green) from SPF mice (n = 6, left), and SS mice (n = 3, right). 8‐oxoG intensity is plotted on the left Y‐axis and Manders' B coefficient of co‐localization on the right. (C) Expression of 3‐nitrotyrosine (3‐NT) proteins (n = 5 for each group). (D) Expression of S‐nitrosylated (SNO) NDUFB8 subunit complex I obtain after biotin switch assay and pull down for SPF mice (n = 5) and SS mice (n = 8). (E) Protein expression of PARKIN full length, PARKIN phospho Ser67, PINK1, BNIP3 (left) and LC3B‐II, P62, PARKIN, PINK1, BECLIN‐1 (right) in quadriceps (n = 5 for each group). (F) mRNA changes of Lc3b and p62 for SPF mice (n = 5) and SS mice (n = 8). SPF, sham pair‐fed mice in dark blue; SS, sepsis‐surviving mice in orange. Each symbol represents one animal. Data expressed as mean values with SEM. Data analysed by Mann–Whitney test. *p < 0.05, **p < 0.01.
FIGURE 5
FIGURE 5
Autophagy flux is disrupted due to reduced degradation of autophagic vacuoles. (A) Dot plot representing the enriched autophagy‐related pathways in module 2 of WGCNA using GO:BP, GO:CC, GO:MF, KEGG and HP sets. (B) Design of the study: Mice were resuscitated and randomly assigned to Ve (0.9% NaCl) or CQ i.p. injection (first dose at 30 mg/kg and then 60 mg/kg/day) at the 12th hour for 10 days. (C) Representative micrographs of SS mice illustrating an autophagic vacuole engulfing a damaged mitochondria (left), numerous aberrant autophagic vacuoles (AVs) and autophagic debris (middle) in tibialis anterior. Black arrow indicates degradative autophagic vacuoles (AVd). Scale bars, 500 nm. Quantification of initial autophagic vacuoles (AVi) and AVd number (n = 4 for each group). (D) Protein expression of LC3B‐II and P62 in soleus (n = 6 for each group). (E) Calculation of the autophagy flux based on LC3B‐II expression. The turnover ratio represents the ratio between the formation ratio and the degradation ratio. The red dotted line represents a balanced autophagy turnover. (F) Protein expression of PINK1 and PARKIN in soleus (n = 6 for each group). CQ, chloroquine injection; SPF, sham pair‐fed mice; SS, sepsis‐surviving mice; Ve, vehicle injection. SPF Ve in dark blue, SPF CQ in light red, SS Ve in orange and SS CQ in dark red. Each symbol represents one animal. Data expressed as mean values with SEM. Data analysed by Kruskal–Wallis test with post hoc Dunn's test (C,D,F), Mann–Whitney test (E). *p < 0.05, **p < 0.01.
FIGURE 6
FIGURE 6
Pharmacological blockade of autophagy flux does not contribute to further mitochondrial damage. (A) PMG‐linked CI‐driven JO2 of soleus pmf (n = 6–7 for each group). (B) OCR curves of isolated mitochondria in tibialis anterior for SPF mice (n = 6–8 for each group). Stars indicate significant difference between OCR curves of SPF CQ mice and SS Ve mice. No difference for SPF Ve versus SPF CQ and SS Ve versus SS CQ. (C,D) Quantification of mitochondria damage (I) and content (J) by TEM analysis (n = 4 for each group). (E) Protein expression of five respiratory chain subunits (n = 6 for each group). CQ, chloroquine injection; SPF, sham pair‐fed mice; SS, sepsis‐surviving mice; Ve, vehicle injection. SPF Ve in dark blue, SPF CQ in light red, SS Ve in orange, SS CQ in dark red. Each symbol represents one animal. Data expressed as mean values with SEM. Data analysed by Kruskal–Wallis test with post hoc Dunn's test (A,C–E), Mann–Whitney test (F), two‐way ANOVA test with post hoc Tukey test (B). *p < 0.05, **p < 0.01.
FIGURE 7
FIGURE 7
Urolithin A prevents muscle and mitochondrial impairments. (A) Design of the study: Mice were resuscitated and randomly assigned to Pl (300 μL of 0.1% DMSO and 0.9% NaCl) or UA i.p. injection (15 mg/kg every 12 h for 5 days and then every 24 h until day 10). (B) Tibialis anterior phenotype: muscle wet weight (left), myofibre CSA (middle left), myofibre number (middle right), myofibre type (right) (n = 8–10 for each group). One SS Pl value excluded due to cryosection‐related damage; exclusion did not affect the overall results. (C) Ex vivo contractility of soleus: specific force frequency curve measured at 1, 15, 30, 50, 80, 100, 120, 140, 160 and 200 Hz (n = 4–8 for each group). (D) PMG‐linked JO2 of Soleus pmf (n = 10–12 for each group). (E) Protein expression of 3 nitro‐tyrosine (n = 6 for each group). (F) mRNA changes of Pink, Parkin and Bnip3 (n = 8–10 for each group). CQ, chloroquine; Pl, placebo; SPF, sham pair‐fed mice; SS, sepsis‐surviving mice; UA, urolithin A; Ve, vehicle. SPF Pl in dark blue, SPF UA in light yellow, SS Pl in orange and SS UA in light orange. Each symbol represents one animal. Data expressed as mean values with SEM. Data analysed by one‐way ANOVA test with post hoc Fisher's LSD test or Kruskal–Wallis test with post hoc Dunn's test (B,E), mixed‐effects model with post hoc Benjamini–Hochberg correction (F), Welch ANOVA test (F). # SPF versus SS Pl, *p < 0.05, **p < 0.01, ***p < 0.001, ****p < 0.0001.
FIGURE 8
FIGURE 8
Urolithin A reduces muscle alterations by increasing autophagy flux. (A) Representative blot of LC3B‐II and P62 according to UA treatment with or without autophagy blockade by CQ in SPF and SS mice (n = 4 for each group). Calculation of the autophagy flux based on LC3B‐II expression. (B) Representative blot of LC3B‐II and P62 according to UA (50 μM) and CQ (50 μM) incubation in differentiated C2C12 cells challenged by LPS (500 ng/mL) (n = 4 for each group). Calculation of the autophagy flux based on P62 expression. (C) Wet weight of hindlimb muscles (n = 5–9 for each group). (D) PMG‐linked CI‐driven JO2 of soleus pmf (n = 5–7 for each group). (E,F) Cell viability (E) and Mitosox mean fluorescence intensity normalized to Mitogreen (F) in differentiated C2C12 cells challenged by LPS and ATP (n = 3 for each group). CQ, chloroquine; Pl, placebo; SPF, sham pair‐fed mice; SS, sepsis‐surviving mice; Ve, vehicle; UA, urolithin A. SPF Pl in dark blue, SPF UA in light yellow, SPF CQ in light red, SPF CQ UA in dark yellow, SS Pl in orange, SS UA in light orange and SS CQ UA in dark brown. Each symbol represents one animal or biological replicate. Data expressed as mean values with SEM. Data analysed by one‐way ANOVA test with Mann–Whitney test (A,B) and Kruskal–Wallis test with post hoc Dunn's test (C–F). *p < 0.05, **p < 0.01.

References

    1. Singer M., Deutschman C. S., Seymour C. W., et al., “The Third International Consensus Definitions for Sepsis and Septic Shock (Sepsis‐3),” Journal of the American Medical Association 315, no. 8 (2016): 801–810. - PMC - PubMed
    1. Rudd K. E., Johnson S. C., Agesa K. M., et al., “Global, Regional, and National Sepsis Incidence and Mortality, 1990–2017: Analysis for the Global Burden of Disease Study,” Lancet 395, no. 10219 (2020): 200–211. - PMC - PubMed
    1. Voiriot G., Oualha M., Pierre A., et al., “Chronic Critical Illness and Post‐Intensive Care Syndrome: From Pathophysiology to Clinical Challenges,” Annals of Intensive Care 12, no. 1 (2022): 58. - PMC - PubMed
    1. Pierre A., Favory R., Bourel C., et al., “Muscle Weakness After Critical Illness: Unravelling Biological Mechanisms and Clinical Hurdles,” Critical Care 29 (2025): 248. - PMC - PubMed
    1. Poulsen J. B., Rose M. H., Jensen B. R., Møller K., and Perner A., “Biomechanical and Nonfunctional Assessment of Physical Capacity in Male ICU Survivors*,” Critical Care Medicine 41, no. 1 (2013): 93–101. - PubMed

Substances