. 2025 Aug 16;16(1):1566.
doi: 10.1007/s12672-025-03365-7.

PTK6 mediated immune signatures revealed by single cell transcriptomic and multi omics big data analysis in cervical cancer

Affiliations

PTK6 mediated immune signatures revealed by single cell transcriptomic and multi omics big data analysis in cervical cancer

Fen Zhao et al. Discov Oncol. .

Abstract

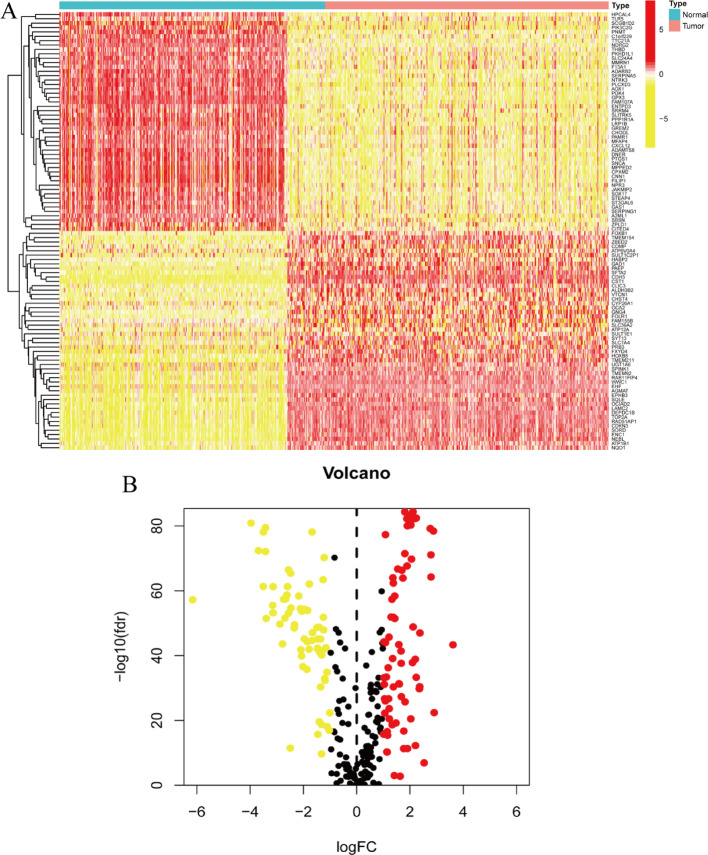
Background: Cervical cancer exhibits heterogeneous clinical outcomes, requiring improved prognostic tools. Single-cell RNA sequencing enables high-resolution analysis of tumor microenvironment cellular heterogeneity. This study developed a prognostic model for cervical cancer through single-cell transcriptomic analysis and immune infiltration characterization, focusing on PTK6 as a key biomarker.

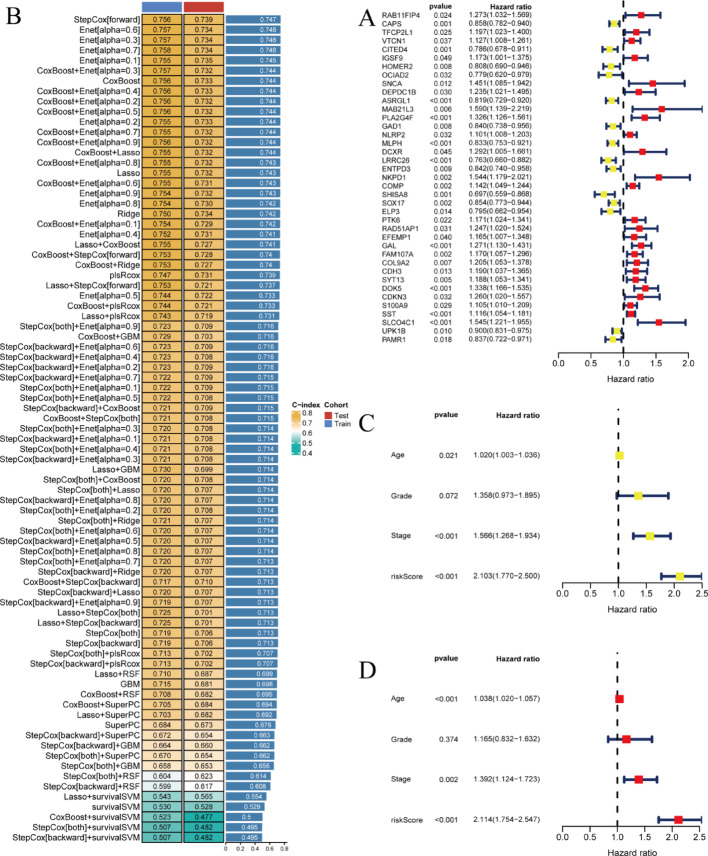
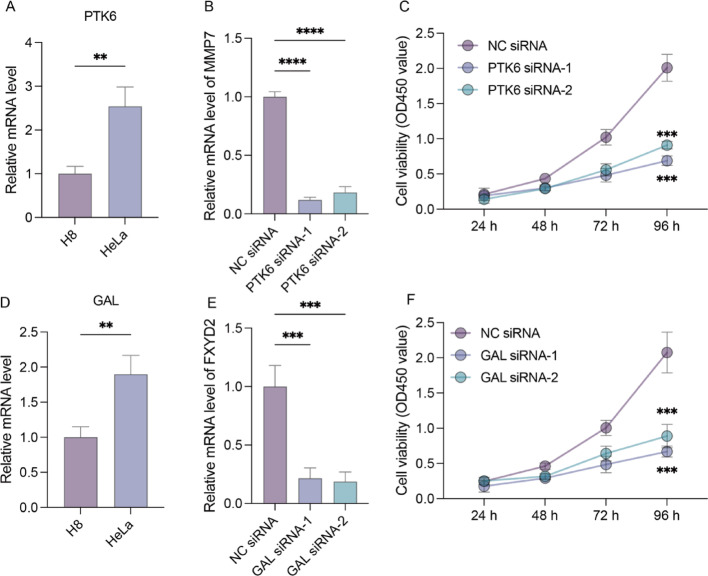
Methods: We analyzed TCGA and GEO transcriptomic data with single-cell RNA sequencing datasets. Fifteen machine learning algorithms constructed prognostic models using immune infiltration-related genes. Single-cell analysis employed Seurat for cell clustering and annotation. PTK6 expression was validated in H8 and HeLa cell lines via RT-qPCR and siRNA knockdown experiments.

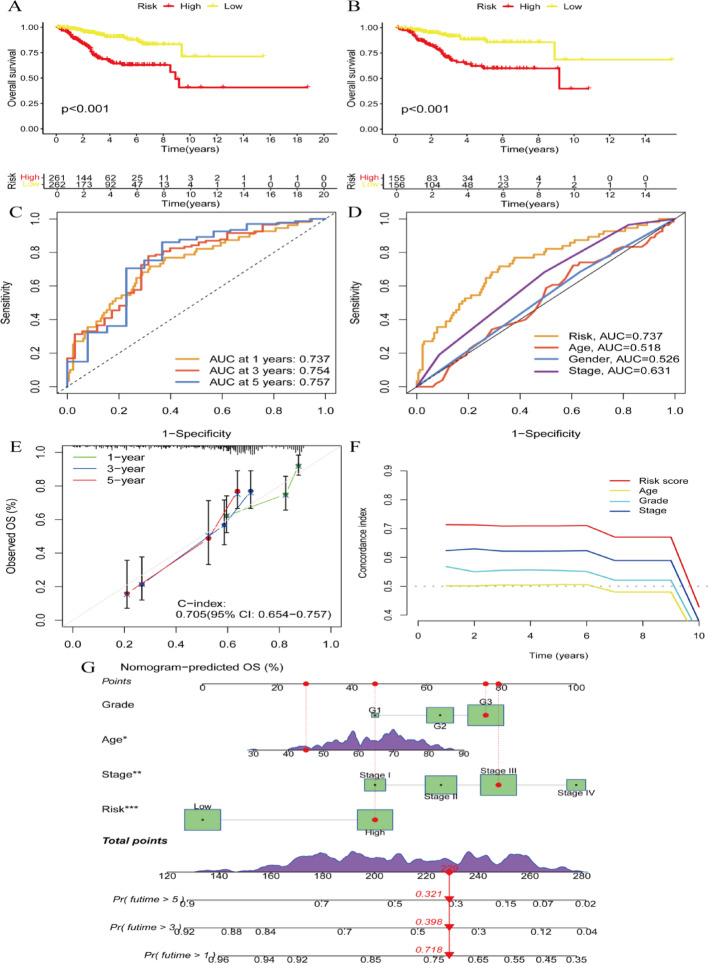
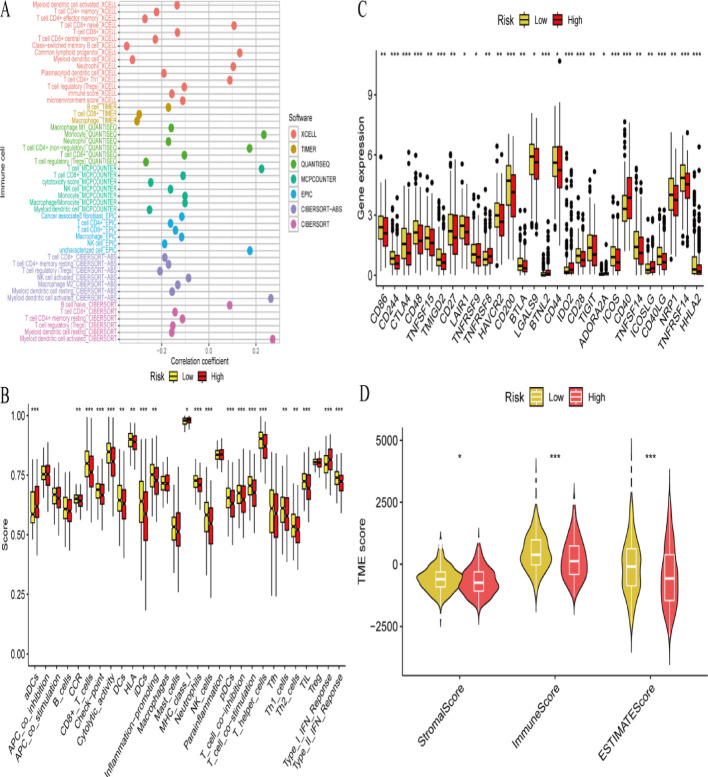
Results: Single-cell sequencing revealed distinct cellular populations including CD8T cells, CD4Tconv cells, and fibroblasts. The prognostic model achieved excellent performance with AUC values of 0.737-0.757 across 1-5 years. PTK6 showed significantly elevated expression in tumors and strong correlations with immune infiltration. Single-cell analysis confirmed PTK6 expression across multiple cell types. Functional validation demonstrated that PTK6 knockdown reduced HeLa cell proliferation, confirming its oncogenic role.

Conclusion: PTK6 emerges as a critical immune infiltration-related prognostic biomarker through single-cell transcriptomic analysis.

Keywords: Cervical cancer; Immune infiltration; Machine learning; PTK6; Prognostic biomarker; Single-cell RNA sequencing.


Conflict of interest statement

Declarations. Ethics approval: Not available. Consent to publish: All authors reviewed and approved the final manuscript. Consent to participate: Not available. Competing interests: The authors declare no competing interests.

Figures

Fig. 1
Fig. 1
The differences in gene expression between normal and tumor tissues. A Heatmap displays the differential gene expression between normal and tumor samples. B Volcano plot visualizes the statistical significance and magnitude of differential gene expression between normal and tumor samples. B Volcano Plot The volcano plot highlights genes that are significantly differentially expressed between tumor and normal samples
Fig. 2
Fig. 2
Different types of data related to gene expression and prognostic analysis. A Forest plot of hazard ratios for genes shows the hazard ratios (HR) and confidence intervals (CI) for various genes, indicating their impact on survival. B Model performance table compares the performance of different predictive models. C Forest plot for clinical factors shows the impact of clinical factors (age, grade, stage, risk score) on survival in the training cohort. D Forest plot for clinical factors shows the impact of clinical factors (age, grade, stage, risk score) on survival in the test cohort
Fig. 3
Fig. 3
Survival analysis and model evaluation for a prognostic study. A and B Kaplan-Meier survival curves compare overall survival between high-risk and low-risk groups. C and D ROC curves evaluate the performance of the risk model in predicting survival at different time points. C ROC curves for the risk model at 1, 3, and 5 years. D Comparison of ROC curves for risk score, age, gender, and stage. E Calibration plot assess the agreement between predicted and observed survival probabilities. F Time-Dependent C-index shows the model’s predictive accuracy over time. G Nomogram provides a visual tool to predict individual patient survival probabilities based on multiple factors
Fig. 4
Fig. 4
Immune cell infiltration and its correlation with risk groups. A Bubble plot of immune cell infiltration shows the correlation between immune cell infiltration and risk scores using different software tools. B Box plot of immune cell scores compares the scores of various immune cells between low-risk and high-risk groups. C Box plot of gene expression compares the expression levels of specific genes between low-risk and high-risk groups. D Violin plot of tumor microenvironment scores compares tumor microenvironment (TME) scores between low-risk and high-risk groups
Fig. 5
Fig. 5
Biological processes and pathways associated with different risk groups. A Gene Set Enrichment Analysis (GSEA) plots identify pathways and biological processes that are significantly enriched in high-risk and low-risk groups. B Bar plots of functional enrichment analysis summarize the results of functional enrichment analysis, highlighting key biological processes, cellular components, molecular functions, and pathways
Fig. 6
Fig. 6
Analyze gene expression differences between normal and tumor tissues, along with correlation and network analyses. A Differential gene expression analysis compare the expression levels of specific genes between normal and tumor samples. B Correlation heatmap show the correlation between the expression levels of the selected genes. C Gene co-expression network visualize the co-expression relationships among the selected genes
Fig. 7
Fig. 7
The expression of PTK6/GAL gene in the H8 and HeLa cell lines. A, D, Relative human PTK6/GAL mRNA expression measured by RT-qPCR in the H8 and HeLa cell lines (n = 3 biological replicates). B, E, Relative human PTK6/GAL mRNA expression measured by RT-qPCR in the HeLa cell line after specified treatments (n = 3 biological replicates). C, F, Quantification of cell proliferative capacity in the HeLa cell line after specified treatments (n = 3 biological replicates)
Fig. 8
Fig. 8
Explore the correlation between drug sensitivity and mRNA expression. A and B panels provide a comprehensive analysis of the relationship between gene expression and drug sensitivity in cancer cells. By comparing data from two different drug sensitivity datasets (CTRP and GDSC)
Fig. 9
Fig. 9
Various genomic and epigenomic factors in relation to cancer prognosis and gene expression. A shows how CNVs correlate with gene expression. B highlights the impact of CNVs on survival outcomes. C provides a mutation overview. D compares survival between mutant and WT groups. E analyzes methylation differences. F evaluates the impact of methylation on survival
Fig. 10
Fig. 10
The correlation between gene expression and immune cell infiltration. A Highlights correlations with various immune cells, suggesting potential roles in immune modulation. B Shows how gene expression correlates with stromal and immune components, indicating their influence on the tumor microenvironment. C Offers a detailed view of correlations with specific immune cell subtypes, providing deeper insights into immune interactions
Fig. 11
Fig. 11
Cell clustering and composition by single-cell RNA sequencing. A Shows the clustering of cells based on gene expression, indicating diversity in cell populations. B Annotates clusters with specific cell types, providing insights into the functional roles of these cells. C Highlights the variability in cell type proportions across different patients, indicating patient-specific immune landscapes. D Summarizes the overall distribution of cell types, showing the predominance of certain immune cells
Fig. 12
Fig. 12
The expression of specific genes across cells in a single-cell RNA sequencing dataset. These UMAP plots provide a visual representation of the expression patterns of various genes across a dataset of cells. By examining these plots, one can identify which genes are highly expressed in specific cell clusters, which can provide insights into the roles of these genes in different cell types

Similar articles

References

    1. Dirakwaranon W, Suwannarurk K, Chitkoolsamphan Y, Wisarnsirirak P, Bhamarapravatana K, Pattaraarchachai J. Sexual dysfunction in patient’s diagnosed with cervical cancer in comparison to the healthy female population. Asian Pac J Cancer Prev. 2024;25(12):4391–6. - PMC - PubMed
    1. Shamsutdinova A, Kulkayeva G, Karashutova Z, Tanabayev B, Tanabayeva S, Ibrayeva A, Fakhradiyev I. Analysis of the effectiveness and coverage of breast, cervical, and colorectal cancer screening programs in Kazakhstan for the period 2021–2023: regional disparities and coverage dynamics. Asian Pac J Cancer Prev. 2024;25(12):4371–80. - PMC - PubMed
    1. Wu Z, Lu L, Xu C, Wang D, Zeng B, Liu M. Development and external validation of a multi-task feature fusion network for CTV segmentation in cervical cancer radiotherapy. Radiother Oncol 2024:110699. - PubMed
    1. Guo S, Jiang H, Deng Y, Dong Y, Yin A, Wang Q, Lan Q, Zhang Y, Xu C. Reduced 2,4-dienoyl-CoA reductase 1 is served as an unfavorable biomarker and is related to immune infiltration in cervical cancer. J Obstet Gynaecol Res. 2023;49(10):2475–86. - PubMed
    1. Wei HF, Zhang RF, Zhao YC, Tong XS. SERPINB7 as a prognostic biomarker in cervical cancer: association with immune infiltration and facilitation of the malignant phenotype. Heliyon. 2023;9(9):e20184. - PMC - PubMed