. 2025 Aug 16;16(1):7644.
doi: 10.1038/s41467-025-62628-7.

Regulatory T cell therapy promotes TGF-β and IL-6-dependent pro-inflammatory Th17 cell generation by reducing IL-2

Affiliations

Regulatory T cell therapy promotes TGF-β and IL-6-dependent pro-inflammatory Th17 cell generation by reducing IL-2

Hao Cheng et al. Nat Commun. .

Abstract

CD4+Foxp3+ regulatory T cells are essential for maintaining immune tolerance and preventing excessive inflammation, making them promising candidates for treating autoimmunity and GvHD. However, the translation of regulatory T cell therapy into clinical practice poses substantial challenges. Here, we show that adoptive regulatory T cell therapy increases IL-6 and TGF-β-dependent pathogenic Th17 cell differentiation in murine models of inflammatory bowel disease and experimental autoimmune encephalomyelitis. Regulatory T cells increase the p-stat3/p-stat5 ratio in effector T cells by suppressing IL-2 secretion and competitively consuming IL-2, thereby promoting Th17 cell differentiation. Notably, IL-2 signaling deficiency not only promotes a Th17 cell-associated transcriptional program, but also enhances the pro-inflammatory properties of Th17 cells. Strikingly, therapeutic blockade of IL-6/STAT3 signaling pathway can reverse pathogenic Th17 cell differentiation and enhance the therapeutic effect of regulatory T cell therapy. Thus, our findings could potentially advance the clinical research progress of adoptive regulatory T cell therapy.


Conflict of interest statement

Competing interests: The authors declare no competing interests.

Figures

Fig. 1
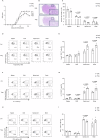
Fig. 1. Adoptive polyclonal Treg cell transfer promotes Th17 cell generation in IBD.
Rag1−/− mice were intravenously injected with CD45.2+CD4+CD25-CD45RBhi T cells, with or without CD45.1+CD4+CD25+ Tregs, and then observed for the development of colitis. A Weight changes of Rag1−/− mice post T cell transfer. B Representative histology images of colon sections. Scale bars, 500 μm. C Total Immune cell numbers in the spleen, mesenteric lymph nodes (MLN) and colon tissues of indicated mice. D Uniform manifold approximation and projection (UMAP) plot of all immune cells colored by cell types. E Fraction of different immune cell types in indicated mice. F UMAP plot of all T cells colored based on cell type. G Fraction of different cell types among all T cells in the indicated mice. H, I Flow cytometry analysis of frequencies of total CD4+IL-17+ Th17 cells. J Frequencies of CD45.1+Th17 cells (black box) and CD45.2+Th17 cells (gray box) among total Th17 cells in the spleen, MLN and colon tissues of the Treg cell therapy group. K, L Flow cytometry to detect the frequencies of CD45.2+CD4+IL-17+ T cells (K) and CD45.2+CD4+RORγt+ T cells (L) in CD45.2+CD4+ cells. Sample sizes: (A, C, I, J, K and L) n = 3 mice per group. Data are representative of two independent experiments. Statistical testing by two-way ANOVA with multiple comparisons test (A) or unpaired two-tailed Student’s t tests (C, I, J, K and L). Summary data are presented as mean ± SEM. Source data are provided as a Source Data file.
Fig. 2
Fig. 2. Adoptive transfer of antigen-specific Tregs promotes Th17 cell generation in EAE.
C57BL/6 mice were subcutaneously injected with MOG35-55 peptide emulsified in complete Freund’s adjuvant (CFA) to induce EAE, and MOG-specific Tregs were injected intravenously into mice of the Treg cell therapy group on day 9. A EAE clinical scores of the indicated groups. B Representative histology images of spinal cord sections. Scale bars, 400 μm. C Total Immune cell numbers in the spleen, DLN, brain and spinal cord tissues of indicated mice. D–I Representative flow cytometry plots and bar graphs showing frequencies of CD4+Foxp3+ Tregs (D, E), IL-17+CD4+ Th17 cells (F, G) and IFN-γ+CD4+ T cells (H, I) in the spleen, DLN, brain and spinal cord tissues of indicated mice. Sample sizes: (A) n = 8 mice per group; (C, E, G and I) n = 4 mice per group. Data are pooled from two independent experiments (A) or are representative of two independent experiments (BI). Statistical testing by two-way ANOVA with multiple comparisons test (A) or unpaired two-tailed Student’s t tests (C, E, G and I). Summary data are presented as mean ± SEM. Source data are provided as a Source Data file.
Fig. 3
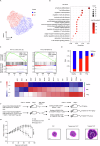
Fig. 3. Adoptive Treg cell therapy-induced Th17 cells exhibit high pathogenicity.
A UMAP plot of all Th17 cells colored by clusters. B Bubble plot showing the top 15 GO (BP) terms (rows) for C1 upregulated gene enrichment pathways. Functional enrichment analysis was performed using clusterProfiler via over-representation analysis (ORA), which employs the hypergeometric test to calculate enrichment p-values. The Benjamini-Hochberg method controlled the false discovery rate (FDR) across all tested gene sets. C Gene set enrichment analysis (GSEA) of pathogenic Th17-related genes in C1, comparing C0. NES: normalized enrichment score. NES were computed using a weighted enrichment statistic applied to signal-to-noise-ranked genes. P-value for each gene set was estimated through gene set permutation (n = 1000). The BH method controlled the FDR across all tested gene sets. D Fraction of the different clusters in the indicated groups. E Heat map shows the average expression levels of pathogenic/non-pathogenic Th17-related genes (columns; Z normalized per column) in the indicated groups (rows, after batch correction). F Experimental scheme of the IBD model to verify the pathogenicity of Th17 cells induced by Tregs in vivo. G, H CD45.2+CD4+ effector T cells isolated from the IBD group, CD45.2+ CD4+IL17(eGFP)+ Th17 cells and CD45.2+CD4+IL17(eGFP)- effector T cells isolated from the Treg cell therapy group were transferred into Rag1-/- mice and then observed for the development of colitis. G Weight changes of Rag1−/− mice post T cell transfer (n = 3 mice per group); mean ± SD, two-way multiple-range ANOVA test. H Representative histology images of colon sections. Scale bars, 500 μm. Data are representative of two independent experiments (G, H). Source data are provided as a Source Data file.
Fig. 4
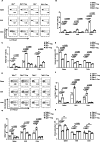
Fig. 4. Adoptive Treg cell therapy-induced Th17 cell generation requires IL-6 and TGF-β signaling in vivo.
AD Rag1-/- mice were injected with CD45.2+CD4+CD25-CD45RBhi T cells isolated from Il6ra+/+ or Il6ra-/- mice, with or without CD45.1+CD4+CD25+ Tregs from CD45.1 mice. The experiment was ended 5-6 weeks post T cell transfer, before the mice started losing weight (n = 3 mice per group). A–C Representative flow cytometry plots and bar graphs showing frequencies of CD45.2+CD4+IL-17+ Th17 cells (A, B), and CD45.2+ CD4+RORγt+ T cells (C) in spleen, MLN and colon tissues of indicated mice. D Total immune cell numbers in the spleen, MLN and colon tissues of the indicated mice. EH Rag1-/- mice were injected with CD45.2+CD4+CD25-CD45RBhi T cells isolated from Tgfbr1f/f ER-Cre+ mice treated with tamoxifen (Tgfbr1-/-) or oil (Tgfbr1+/+), with or without CD45.1+CD4+CD25+ Tregs from CD45.1 mice. The experiment was ended 5-6 weeks post T cell transfer, before the mice started to lose weight (n = 4 mice per group). EG Representative flow cytometry plots and bar graphs showing frequencies of CD45.2+CD4+IL-17+ Th17 cells (E, F), and CD45.2+CD4+RORγt+ T cells (G) in spleen, MLN and colon tissues of indicated mice. H Total Immune cell numbers in the spleen, MLN and colon tissues of indicated mice. Data are representative of two independent experiments. ns, not significant, one-way ANOVA with Tukey’s post hoc test. Summary data are presented as mean ± SEM. Source data are provided as a Source Data file.
Fig. 5
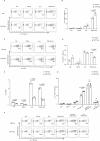
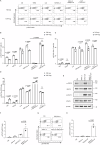
Fig. 5. Tregs promote Th17 cell differentiation by reducing IL-2.
Naïve CD4+ T cells isolated from C57BL/6 mice were stimulated with anti-CD3 and antigen-presenting cells (APCs) in the presence or absence of Tregs (1:1 ratio), and cultured in indicated polarization conditions. A, B Representative flow cytometry plots and a bar graph showing frequencies of CD4+IL-17+ Th17 cells among T cells cultured for three days. C, D Representative flow cytometry plots and a bar graph showing frequencies of IL2+CD4+ T cells among T cells cultured for 24 h. E Amount of IL-2 in the culture supernatant was detected using enzyme-linked immunosorbent assay (ELISA) after 24 h of culture. F, G Representative flow cytometry plots and a bar graph showing frequencies of CD4+IL-17+ Th17 cells among T cells cultured in the indicated polarization conditions for three days. Data are pooled from three biological replicates. Summary data are presented as mean ± SEM. *p < 0.05, **p < 0.01, ***p < 0.001, ****p < 0.0001, ns, not significant, unpaired two-tailed Student’s t tests. Source data are provided as a Source Data file.
Fig. 6
Fig. 6. Tregs promote Th17 cell differentiation by elevating the p-STAT3/p-STAT5 ratio in Teffs.
AD Naïve CD4+ T cells isolated from C57BL/6 mice were stimulated with anti-CD3 and APCs in the presence or absence of Tregs (1:1 ratio), and cultured in the indicated polarization conditions. Representative flow cytometry plots and bar graphs showing frequencies of p-STAT5+CD4+ T cells (A, B) and p-STAT3+CD4+ T cells (C) in T cells cultured for 24 hours. D Bar graph showing the ratio of p-STAT3+CD4+cells to p-STAT5+CD4+cells. EH Naïve CD4+ T cells isolated from C57BL/6 mice were cultured with anti-CD3 and anti-CD28 in the indicated polarization conditions. E Immunoblotting of STAT5, p-STAT5, STAT3, and p-STAT3 in T cells cultured for 24 h. F Density values of the Immunoblot were measured using Image J, and the ratio of p-STAT3 to p-STAT5 was calculated. The samples derive from the same experiment, and the blots were processed in parallel. G Representative flow cytometry plots showing frequencies of p-STAT5+CD4+ T cells after 24 h culture. H Bar graph showing the ratio of p-STAT3+CD4+ T cells to p-STAT5+CD4+ T cells after 24 h culture. Data are pooled from three biological replicates. Data were analyzed by unpaired two-tailed Student’s t tests (B, C and D) or one-way ANOVA with Tukey’s post hoc test (F and H). Summary data are presented as mean ± SEM, ns, not significant. Source data are provided as a Source Data file.
Fig. 7
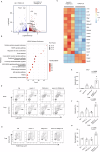
Fig. 7. IL-2 deficiency increases Th17 cell pro-inflammatory features.
AC Naïve CD4+ T cells isolated from C57BL/6 mice were cultured with anti-CD3 and anti-CD28 in ithe ndicated polarization conditions for three days. A Volcano plot showing differentially expressed genes (DEGs) of Anti-IL-2 + TGF-β + IL-6 compared to TGF-β + IL-6 (p < 0.05 and fold change ≥ 1.5). Differential expression analysis was performed using DESeq2. P-values were calculated with the Wald test, and the BH method controlled the FDR. B Bubble plot showing the KEGG terms (rows) of the upregulated gene enrichment pathways in the Anti-IL-2 + TGF-β + IL-6 group (also refer to Supplementary Data 4). Functional enrichment analysis was performed using clusterProfiler via over-representation analysis (ORA), which employs the hypergeometric test to calculate enrichment p-values. The BH method controlled the FDR across all tested gene sets. C Heat map showing the expression levels of pathogenic/non-pathogenic Th17-related genes (rows; Z normalized per row) that are differentially expressed in T cells cultured in the indicated conditions (columns). DH Naïve CD4+ T cells isolated from OT-II TCR transgenic mice were cultured with anti-CD3 and anti-CD28 in the indicated polarization conditions for three days, and were then adoptively transferred into C57BL/6 mice to establish an acute pulmonary inflammation model. DF Representative flow cytometry plots (D) and bar graphs (E, F) showing frequencies of CD11b+Ly6G+ neutrophils in BALF and lung tissues. G, H Representative flow cytometry plots (G) and bar graph (H) showing frequencies of F4/80+ Macrophage in lung tissue. Sample sizes: (E, F and H) n = 3 mice per group. Data are representative of two independent experiments. Summary data are presented as mean ± SEM, one-way ANOVA with Tukey’s post hoc test. Source data are provided as a Source Data file.
Fig. 8
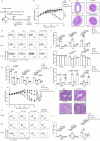
Fig. 8. Improving the efficacy of adoptive Treg cell therapy by blocking IL-6/STAT3 signaling in the IBD model.
AH Rag1-/- mice were injected with 4 × 105 CD45.2+CD4+CD25-CD45RBhi T cells isolated from C57BL/6 mice, with or without 1 × 105 CD45.1+CD4+CD25+ Tregs from CD45.1 mice and anti-IL-6 neutralizing antibody (300 μg/mouse every three days), and then observed for the development of colitis (n = 4 mice per group). A Experimental scheme of the combination therapy of the IBD model. B Weight changes of Rag1-/- mice post T cell transfer. C Representative histology images of colon sections. Scale bars, 500 μm. DF Representative flow cytometry plots and bar graphs showing frequencies of CD45.2+CD4+IL-17+ Th17 cells (D, E), and CD45.2+CD4+IFN-γ+ Th1 cells (F) in the spleen, MLN and colon tissues of indicated mice. G A bar graph showing total Immune cell numbers in the spleen, MLN and colon tissues of the indicated mice. H A bar graph showing frequencies of total CD4+Foxp3+ Tregs in the spleen, MLN and colon tissues of indicated mice. IL Rag1-/- mice were injected with 6 × 105 CD45.2+CD4+CD25-CD45RBhi T cells isolated from C57BL/6 mice, with or without 0.5 × 105 CD45.1+CD4+CD25+ Tregs from CD45.1 mice and anti-IL-6 neutralizing antibody (100 μg/mouse every four days), and then observed for the development of colitis (n = 4 mice per group). I Weight changes of Rag1-/- mice post T cell transfer. J Representative histology images of colon sections. Scale bars, 250 μm. (K and L) Representative flow cytometry plots and a bar graph showing frequencies of CD45.2+CD4+IL-17+ Th17 cells. Data were analyzed by two-way multiple-range ANOVA test (B, I), one-way ANOVA with Tukey’s post hoc test (EH and L). Data are representative of two independent experiments. Summary data are presented as mean ± SEM, ns, not significant. Source data are provided as a Source Data file.
Fig. 9
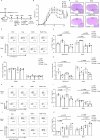
Fig. 9. Improving the efficacy of adoptive antigen-specific Treg cell therapy by blocking IL-6/STAT3 signaling in the EAE model.
C57BL/6 mice were subcutaneously injected with MOG35-55 peptide emulsified in CFA to induce EAE, with or without MOG-specific Tregs and Stattic treatment, and then observed for the development of EAE. A Experimental scheme of the combination therapy of the EAE model. B EAE clinical scores of indicated groups (n = 8 mice per group). C Representative histology images of spinal cord sections. Scale bars, 500 μm. D, E Representative flow cytometry plots and a bar graph showing frequencies of CD4+IL-17+ Th17 cells in the brain and spinal cord tissues of the indicated mice. F, G Bar graphs showing total Immune cell numbers in the spleen, DLN, spinal cord and brain tissues of the indicated mice. HK Representative flow cytometry plots and bar graphs showing frequencies of CD4+IFN-γ+ Th1 cells (H, I) and CD4+ Foxp3+ Tregs (J and K) in the brain and spinal cord tissues of indicated mice. Sample sizes: (B) n = 8 mice per group; (EG, I and K) n = 4 mice per group. Data were analyzed by unpaired two-tailed Student’s t tests (B and I) or one-way ANOVA with Tukey’s post hoc test (EG and K). Data are representative of two independent experiments (CK) or are pooled from two independent experiments (B). Summary data are presented as mean ± SEM, ns, not significant. Source data are provided as a Source Data file.

References

    1. Sakaguchi, S., Sakaguchi, N., Asano, M., Itoh, M. & Toda, M. Immunologic self-tolerance maintained by activated T cells expressing IL-2 receptor alpha-chains (CD25). Breakdown of a single mechanism of self-tolerance causes various autoimmune diseases. J. Immunol.155, 1151–1164 (1995). - PubMed
    1. Fontenot, J. D., Gavin, M. A. & Rudensky, A. Y. Foxp3 programs the development and function of CD4+CD25+ regulatory T cells. Nat. Immunol.4, 330–336 (2003). - PubMed
    1. Sakaguchi, S., Wing, K., Onishi, Y., Prieto-Martin, P. & Yamaguchi, T. Regulatory T cells: how do they suppress immune responses?. Int. Immunol.21, 1105–1111 (2009). - PubMed
    1. Vignali, D. A. A., Collison, L. W. & Workman, C. J. How regulatory T cells work. Nat. Rev. Immunol.8, 523–532 (2008). - PMC - PubMed
    1. Raffin, C., Vo, L. T. & Bluestone, J. A. T(reg) cell-based therapies: challenges and perspectives. Nat. Rev. Immunol.20, 158–172 (2020). - PMC - PubMed

MeSH terms

LinkOut - more resources