. 2025 Aug 16;16(1):7648.
doi: 10.1038/s41467-025-62689-8.

Genkwanin glycosides are major active compounds in Phaleria nisidai extract mediating improved glucose homeostasis by stimulating glucose uptake into adipose tissues

Affiliations

Genkwanin glycosides are major active compounds in Phaleria nisidai extract mediating improved glucose homeostasis by stimulating glucose uptake into adipose tissues

Carla Horvath et al. Nat Commun. .

Abstract

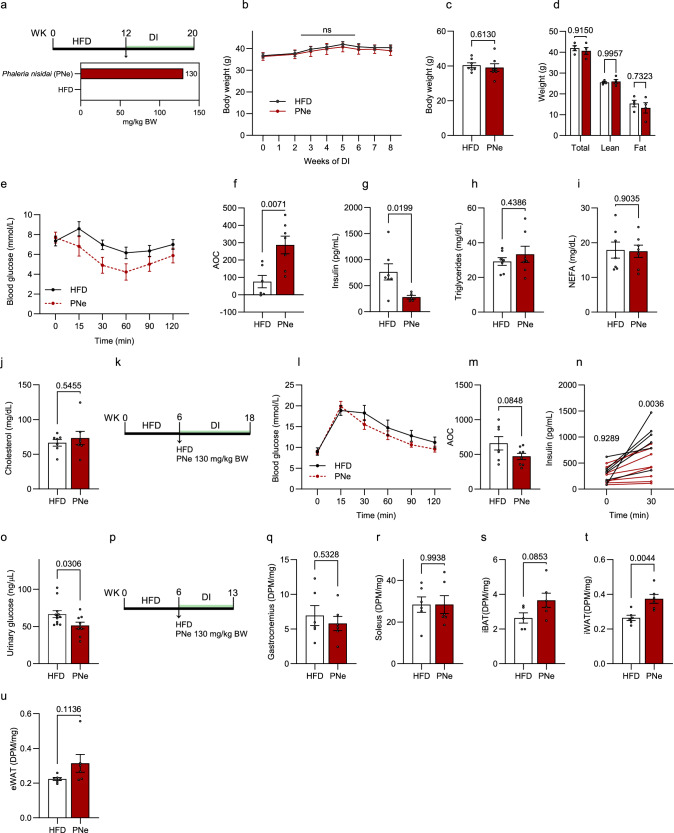
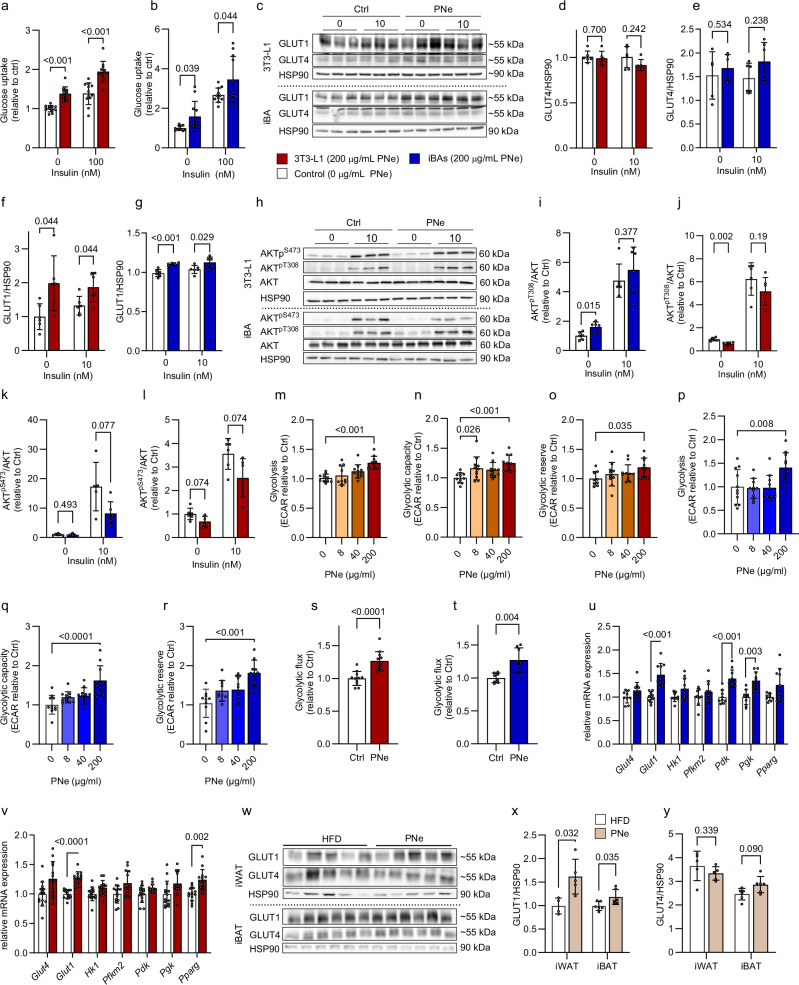
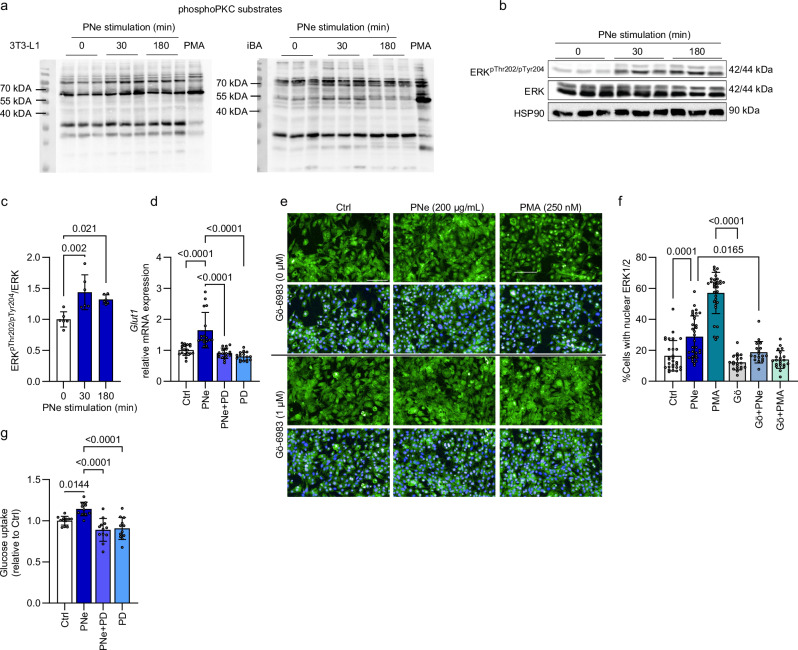
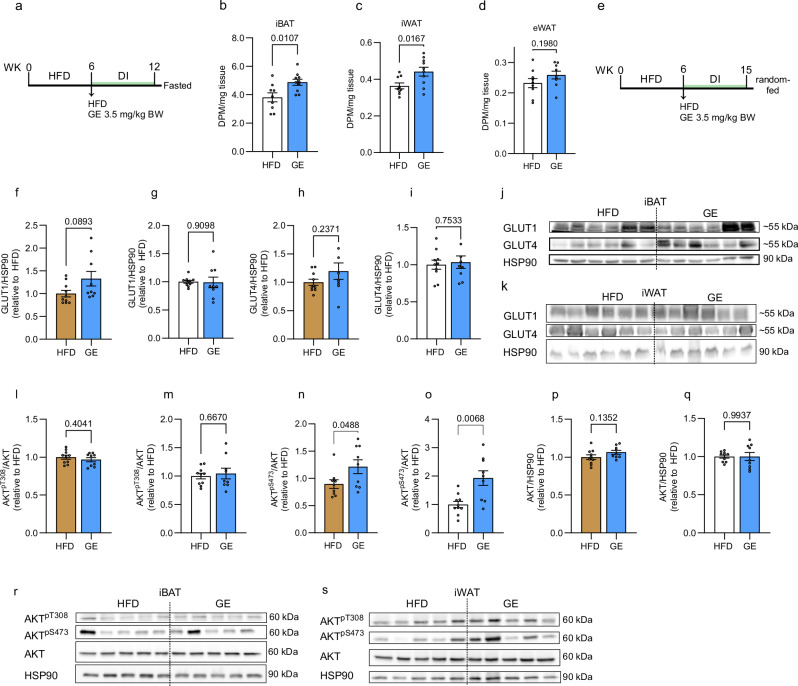
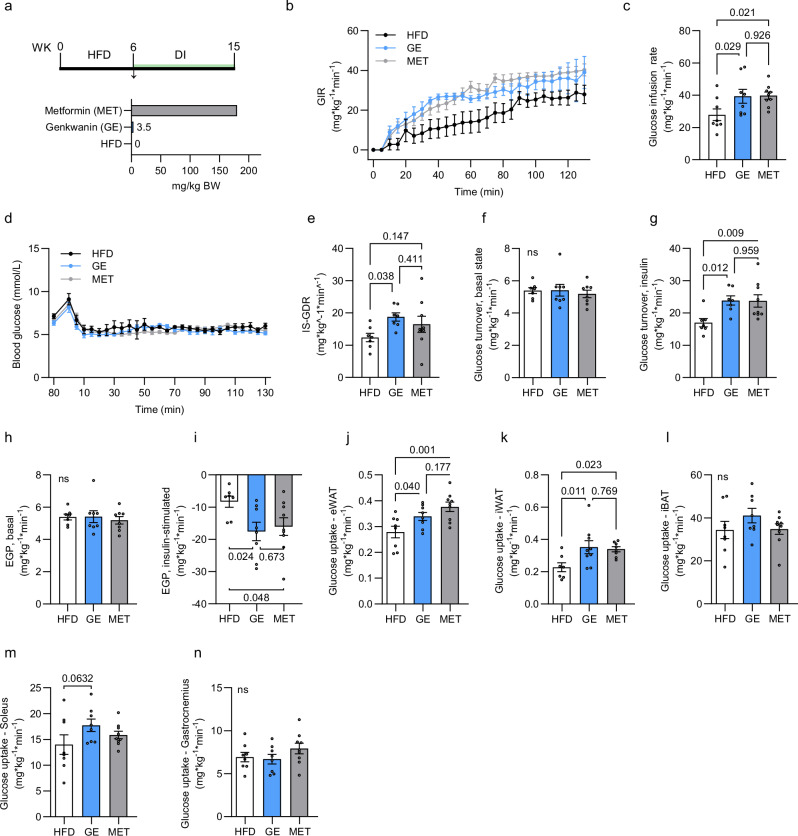
Natural remedies are used as standalone treatments or complementary to modern medicine to control type 2 diabetes. In Palau, the traditional leaf decoction of Phaleria nisidai (PNe) is selected to treat hyperglycemia and its efficacy has been supported by a small clinical trial. As part of a reverse pharmacology approach, we here investigated the anti-diabetic potential of PNe and its bioactive compounds to alleviate insulin resistance in diet-induced obese, male mice. Dietary supplementation with PNe improves insulin sensitivity and promotes glucose uptake into adipose depots. In vitro, PNe triggers glucose disposal into murine and human adipocytes by upregulating Glut1 expression through PKC-ERK1/2 signaling. To identify active constituents in PNe, we conducted bioactivity-guided fractionations and deciphered genkwanin flavone glycosides as bioactive principles. Moreover, we demonstrate that the aglycone genkwanin (GE) improves insulin resistance to a comparable extent to the anti-diabetic drug, metformin. Our findings present GE as promising glucoregulatory phytochemical that facilitates glucose uptake into adipocytes, thereby reducing systemic glucose load and enhancing insulin sensitivity.


Conflict of interest statement

Competing interests: The authors declare no competing interests.

Figures

Fig. 1
Fig. 1. PNe alleviates glucose homeostasis in diet-induced obese mice.
a Experimental design for (bj). b Body weight development. HFD n = 7, PNe n = 7. c Final body weight. DI = 8 weeks. HFD n = 7, PNe n = 7. d Body composition. DI = 5 weeks. HFD n = 4, PNe n = 4. e ITT and f corresponding AOC. DI = 5 weeks. HFD n = 6, PNe n = 7. gj Fasting plasma g insulin (HFD n = 7, PNe n = 5), h triglyceride (HFD n = 7, PNe n = 7), i NEFA (HFD n = 7, PNe n = 7), and j cholesterol (HFD n = 7, PNe n = 7) concentrations. DI = 8 weeks. k Experimental design for (lo). l oGTT and m corresponding AOC. DI = 2.5 weeks DI. HFD n = 7, PNe n = 8. n Plasma insulin levels during oGTT in l, m at baseline (HFD n = 7, PNE n = 8) and 30 min after the glucose load (HFD n = 6, PNe n = 8). o Urinary glucose concentration. DI = 6 weeks. (HFD n = 12, PNe n = 9). p Experimental design for (qu). qu Tissue specific 14C-2-deoxyglucose glucose uptake into q gastrocnemius, r soleus, s iBAT, t iWAT, and u eWAT. DI = 7 weeks. HFD n = 6, PNe n = 6 for all tissues except BAT. For iBAT, HFD n = 5, PNe n = 6. Results are reported as mean ± SEM. Two-tailed student’s t-test for comparisons between two groups was applied in (c, fj, m, o, ru). Two-way ANOVA with Sidak’s post-hoc test was applied in (d). Repeated measures two-way ANOVA with diet × time interaction and Sidak’s post-hoc test for each time point was applied in (b). Repeated measures mixed-effects analysis with diet × time interaction and Sidak’s post-hoc test for each time point was applied in (n). Statistical test results are indicated as exact p-values with *p < 0.05 considered significant. Source data are provided in Source Data 1 AOC area of the curve, NEFA non-esterified fatty acids, DPM decays per minute, DI dietary intervention, PNe Phaleria nisidai extract, iWAT inguinal white adipose tissue, eWAT epididymal white adipose tissue, iBAT interscapular brown adipose tissue, ITT insulin tolerance test, oGTT oral glucose tolerance test.
Fig. 2
Fig. 2. PNe increases adipocyte glucose uptake via insulin independent GLUT1 in vitro.
Cells were treated daily with PNe (0, 200 µg/mL) for 3 days. a Glucose uptake in 3T3-L adipocytes. 0 nM insulin: Ctrl n = 12, PNe n = 11. 10 nM insulin (60 min): Ctrl n = 12, PNe n = 11. b Glucose uptake in iBAs. 0 nM insulin: Ctrl n = 11, PNe n = 11. 10 nM insulin (60 min): Ctrl n = 11, PNe n = 11. c Western blots for GLUT1 and GLUT4 in adipocyte cell lines. d, e GLUT4 quantification for d 3T3-L1 adipocytes (0 nM, 10 nM insulin: Ctrl n = 6, PNe n = 6) and e iBAs (0 nM insulin: Ctrl n = 5, PNe n = 6. 10 nM insulin: Ctrl n = 6, PNe n = 6). f, g GLUT1 quantification for f 3T3-L1 adipocytes. (0 nM, 10 nM insulin: Ctrl n = 6, PNe n = 6) and g iBAs (0 nM, 10 nM insulin: Ctrl n = 6, PNe n = 6). h AKTpT308 and AKTpS473 Western blots with or without insulin stimulation (20 min, 10 nM) in adipocyte cell lines. i, j AKTpT308 quantification for i iBAs (Ctrl n = 6, PNe n = 6 for 0 nM and 10 nM insulin) and j for 3T3-L1 adipocytes (Ctrl n = 6, PNe n = 6 for 0 nM and 10 nM insulin). k, l AKTpS473 quantification for k iBAs (0 nM insulin: Ctrl n = 6, PNe n = 6. 10 nM insulin: Ctrl n = 5, PNe n = 6) and l 3T3-L1 adipocytes (Ctrl n = 6, PNe n = 6 for 0 nM and 10 nM insulin). m, n Glycolytic stress test in 3T3-L1 adipocytes. m Glycolysis (0 μg/mL n = 10, 8 μg/mL n = 10, 40 μg/mL n = 11, 200 μg/mL n = 10), n Glycolytic capacity (0 μg/mL n = 11, 8 μg/mL n = 11, 40 μg/mL n = 11, 200 μg/mL n = 11) and o Glycolytic reserve (0 μg/mL n = 9, 8 μg/mL n = 10, 40 μg/mL n = 11, 200 μg/mL n = 10). pr Glycolytic stress test in iBAs. p Glycolysis (0 μg/mL n = 11, 8 μg/mL n = 10, 40 μg/mL n = 11, 200 μg/mL n = 11), q Glycolytic capacity (0 μg/mL n = 11, 8 μg/mL n = 11, 40 μg/mL n = 11, 200 μg/mL n = 11) and r Glycolytic reserve (0 μg/mL n = 10, 8 μg/mL n = 10, 40 μg/mL n = 11, 200 μg/mL n = 10). s, t 3H-Glycolytic flux analysis of (s) 3T3-L1 (Ctrl n = 11, PNe n = 12) and t iBAs (Ctrl n = 8, PNe n = 8). u, v mRNA expression of targets regulating glucose metabolism. u 3T3-L1 (Ctrl n = 14, PNe n = 13). v iBAs (Ctrl n = 9, PNe n = 9). w Western blots of x GLUT1 in iWAT (HFD n = 4, PNe n = 5) and iBAT (HFD n = 6, PNe n = 6). y GLUT4 in iWAT (HFD n = 5, PNe n = 5) and iBAT (HFD n = 6, PNe n = 6) from mice. DI = 12 weeks. iBAs blue graphs, 3T3-L1 adipocytes red graphs. Results are reported as mean ± SD. Data points are pooled from two independent experiments, expect for (x, y). Multiple two-tailed t-tests with Holm–Sidak’s multiple-comparison test were applied in (a, b, dg, il, x, y). Two-tailed student’s t-test for comparisons between two groups was applied in (s, t). Two-tailed student’s t-test with Sidak’s multiple comparison adjustment was applied in (u, v). One-Way ANOVA with Dunnett’s post-hoc test was applied in (mr) to compare PNe against 0 μg/mL. Statistical test results are indicated as exact p-values with *p < 0.05 considered significant. Source data are provided in Source Data 1. PNe Phaleria nisidai extract, iBAs immortalized brown adipocytes, ECAR Extracellular acidification rate, iWAT inguinal white adipose tissue, eWAT epididymal white adipose tissue.
Fig. 3
Fig. 3. PNe activates the PKC-ERK1/2 axis in brown adipocytes.
a PhosphoPKC substrates western blot. PMA (250 nM) as positive control. b, c ERK1/2 phosphorylation (Thr204, Tyr202) induced by PNe in b iBAs. c Quantification of ERKpThr202/pTyr204. PNe n = 6, Ctrl n = 6 per time point. 2 independent experiments. Glut1 mRNA levels in iBAs stimulated for 4 h with PNe ± pre-treatment with ERK1/2 inhibitor PD184352 (500 nM, 30 min). Ctrl n = 18, PNe n = 17, PNe+PD n = 16, PD n = 16. 3 independent experiments. e Representative immunofluorescence pictures stained for nuclei (blue) and ERK1/2 (green) in iBAs. Scale bar 100 µM. f Quantification of ERK1/2 localization. 180 min of PNe/PMA treatment ± PKC inhibitor Gö−6983 (1 μM). Ctrl n = 29, PNe n = 33, PMA n = 32, Gö n = 20, Gö + PNe n = 18, Gö + PMA n = 21 images/condition. 3 independent experiments. Average 328 cells/image. g Glucose uptake rates in iBAs after 16 h of PNe ± pre-treatment with ERK1/2 inhibitor PD184352 (500 nM, 30 min). Ctrl n = 12, PNe n = 11, PNe + PD n = 12, PD n = 12. 3 independent experiments. Results are reported as mean ± SD. One-way ANOVA with Tukey’s post-hoc test between all groups was applied in (c, d, f, and g). Only biologically relevant comparisons are displayed. All comparisons are listed in Source Data 1. Statistical test results are indicated as exact p-values with *p < 0.05 considered significant. Source data are provided in Source Data 1. PMA phorbol 12-myristate 13-acetate, PNe Phaleria nisidai extract, PD PD184352.
Fig. 4
Fig. 4. Bioactivity-guided fractionation of PNe reveals F4 as source of bioactive substances.
a Experimental design for (bj). b Random fed blood glucose measured at 11 am. HFD n = 8, PNe n = 8, F2 n = 6, F3 n = 6, F4 n = 6. c ITT and d AOC. DI = 4 weeks. HFD n = 7, PNe n = 7, F2 n = 7, F3 n = 6, F4 n = 6. e ITT and f AOC. DI = 10 weeks. HFD n = 7, PNe n = 8, F2 n = 6, F3 n = 6, F4 n = 6. g oGTT (2 g/kg BW) and h AOC. DI = 12 weeks. HFD n = 8, PNe n = 8, F2 n = 5, F3 n = 6, F4 n = 6. i Circulating active GLP-1 levels 2 min after an oral glucose load. HFD n = 6, PNe n = 7, F2 n = 6, F3 n = 6, F4 n = 5. j Terminal fasting blood glucose concentrations. HFD n = 6, PNe n = 8, F2 n = 6, F3 n = 6, F4 n = 6. k Experimental design for (lt). l Glucose infusion rate (GIR). HFD n = 7, F4 n = 8, MET n = 8. m, n Whole-body glucose turnover in m basal (HFD n = 7, F4 n = 7, MET n = 8) and n insulin-stimulated (HFD n = 7, F4 n = 8, MET n = 8) states. o Endogenous glucose production (EGP) in insulin-stimulated state (HFD n = 7, F4 n = 8, MET n = 8). pt 14C-2-deoxyglucose uptake rates into p eWAT (HFD n = 7, F4 n = 7, MET n = 8), q iWAT (HFD n = 7, F4 n = 7, MET n = 8), r iBAT (HFD n = 7, F4 n = 7, MET n = 7), s soleus (HFD n = 6, F4 n = 6, MET n = 8) and t gastrocnemius (HFD n = 6, F4 n = 7, MET n = 8) in clamped condition. Results are reported as mean ± SEM. Mixed-effects analysis with Diet × Time interaction and Sidak’s multiple comparison was used in (b) to compare each treatment to HFD at each time point. Comparisons were grouped into one family to control FWER, α = 0.05. One-way ANOVA with Dunnet’s post-hoc test compared to HFD was applied in (d, f, hj). One-way ANOVA with uncorrected Fisher’s LSD post-hoc test between all groups was applied in (lt). Statistical test results are indicated as exact p-values with *p < 0.05 considered significant. Source data are provided in Source Data 1. AOC area of the curve, EGP endogenous glucose production, iWAT inguinal white adipose tissue, eWAT epididymal white adipose tissue, iBAT interscapular brown adipose tissue, MET Metformin, ITT insulin tolerance test, oGTT oral glucose tolerance test, FWER family-wise error rate, DI dietary intervention.
Fig. 5
Fig. 5. GE glycosides mediate the beneficial effects of F4.
a Structures of flavones tested in vivo. GP, GG, and IX were isolated in F4. GE and AP were selected as potential metabolites biotransformed in the digestive system after ingestion of the F4-constituents. b Experimental design and applied doses for (ci). c Insulin tolerance tes and d AOC. DI = 7 weeks. n = 20, GG n = 19, GE n = 20. e Glucose tolerance test and f AOC. DI = 8 weeks. HFD n = 19, GG n = 20, GE n = 20. g Random fed blood glucose concentrations after DI = 9 weeks. HFD n = 10, AP n = 8, GE n = 9, GP = 10, GG n = 10, IX n = 10. h Fasting urinary glucose concentrations. DI = 4 weeks. HFD n = 7, AP n = 9, GE n = 9, GP n = 9, GG n = 9, IX n = 10. i Ratio of epididymal (eWAT) to inguinal (iWAT) adipose tissue. HFD n = 10, AP n = 8, GE n = 9, GP n = 10, GG n = 10, IX = 10. Results are reported as mean ± SEM. One-way ANOVA with Dunnett´s post-hoc test against HFD control was applied in (d, fh, and i). One-way ANOVA with uncorrected Fisher’s LSD post-hoc test for (d, f) is displayed in Source Data 1. Statistical test results are indicated as exact p-values with *p < 0.05 considered significant. Source data are provided in Source Data 1 and Source Data 2. iWAT, inguinal white adipose tissue; eWAT, epididymal white adipose tissue.
Fig. 6
Fig. 6. GE supports insulin action by promoting basal glucose uptake.
a Experimental design for (b-d) and 14C-2-deoxyglucose uptake into b iBAT (HFD n = 9, GE n = 10), c iWAT (HFD n = 9, GE n = 10), and d eWAT (HFD n = 9, GE n = 9). DI = 6 weeks. e Experimental design for Western blots depicted in (fq). f, g Effect of GE on GLUT1 protein in f iBAT and g iWAT. HFD n = 10, GE n = 9. h, i Effect of GE on GLUT4 protein in h iBAT and i iWAT. HFD n = 10, GE n = 9. j, k GLUT1 and GLUT4 Western blots quantified from j BAT and k iWAT of random fed mice. DI = 9 weeks. HFD n = 10, GE n = 9. l, m Effect of GE on AKT phosphorylation at T308 in l iBAT and m iWAT. HFD n = 10, GE n = 9. n, o Effect of GE on AKT phosphorylation at S473 in n iBAT (HFD n = 10, GE n = 9) and o iWAT (HFD n = 9, GE n = 9). p, q Effect of GE on total AKT in p iBAT and q iWAT. HFD n = 10, GE n = 9. r, s Western blots quantified from r iBAT and s iWAT of random fed animals, DI = 9 weeks. n = 9–10 per group. Results are reported as mean ± SEM. Two-tailed student’s test was applied in all comparisons. Statistical test results are indicated as exact p-values with *p < 0.05 considered significant. Source data are provided in Source Data 1. iWAT inguinal white adipose tissue, eWAT epididymal white adipose tissue, iBAT interscapular brown adipose tissue, GE genkwanin.
Fig. 7
Fig. 7. GE competes against metformin in hyperinsulinemic-euglycemic clamps.
a Experimental design for hyperinsulinemic-euglycemic clamps. b Representative glucose infusion rate (GIR) over the course of the clamps until 130 min and c GIR during the steady state condition. HFD n = 8, GE, n = 8, Met n = 9. d Blood glucose concentration during the clamp procedure. HFD n = 7, GE, n = 8, Met n = 9. e Insulin-stimulated glucose disappearance rate (IS-GIR) at steady state condition. HFD n = 7, GE, n = 7, Met n = 8. f, g Whole body glucose turnover in f basal state (HFD n = 7, GE n = 8, Met n = 8) and in g insulin-stimulated conditions (HFD n = 7, GE n = 8, Met n = 9). h, i Endogenous glucose production (EGP) in h basal state (HFD n = 7, GE n = 8, Met n = 8) and in i insulin-stimulated conditions (HFD n = 7, GE n = 8, Met n = 9). jn 14C-2-deoxyglucose uptake into j eWAT (HFD n = 8, GE n = 8, Met n = 9), k iWAT (HFD n = 7, GE, n = 9, Met n = 8), l iBAT (HFD n = 8, GE n = 8, MET n = 8), m soleus (HFD n = 8, GE, n = 8, Met n = 9) and n gastrocnemius (HFD n = 8, GE, n = 8, Met n = 9) in clamped condition. Results are reported as mean ± SEM. One-way ANOVA with uncorrected Fisher’s LSD post-hoc test was applied in (c, en). Comparisons were performed between all groups. Statistical test results are indicated as exact p-values with *p < 0.05 considered significant. Source data are provided in Source Data 1. iWAT inguinal white adipose tissue, eWAT epididymal white adipose tissue, iBAT interscapular brown adipose tissue.

References

    1. NCD Risk Factor Collaboration (NCD-RisC) Worldwide trends in diabetes since 1980: a pooled analysis of 751 population-based studies with 4.4 million participants. Lancet387, 1513–1530 (2016). - PMC - PubMed
    1. Kahn, S. E., Hull, R. L. & Utzschneider, K. M. Mechanisms linking obesity to insulin resistance and type 2 diabetes. Nature444, 840–846 (2006). - PubMed
    1. Garvey, W. T. et al. Evidence for defects in the trafficking and translocation of GLUT4 glucose transporters in skeletal muscle as a cause of human insulin resistance. J. Clin. Invest101, 2377–2386 (1998). - PMC - PubMed
    1. Tremblay, F., Lavigne, C., Jacques, H. & Marette, A. Defective insulin-induced GLUT4 translocation in skeletal muscle of high fat-fed rats is associated with alterations in both Akt/protein kinase B and atypical protein kinase C (zeta/lambda) activities. Diabetes50, 1901–1910 (2001). - PubMed
    1. Chadt, A. & Al-Hasani, H. Glucose transporters in adipose tissue, liver, and skeletal muscle in metabolic health and disease. Pflug. Arch.472, 1273–1298 (2020). - PMC - PubMed

MeSH terms

LinkOut - more resources