. 2025 Aug 16;16(1):7637.
doi: 10.1038/s41467-025-63054-5.

Maternal diet-induced alterations in uterine fluid sncRNAs compromise preimplantation embryo development and offspring metabolic health

Affiliations

Maternal diet-induced alterations in uterine fluid sncRNAs compromise preimplantation embryo development and offspring metabolic health

Shijia Pan et al. Nat Commun. .

Abstract

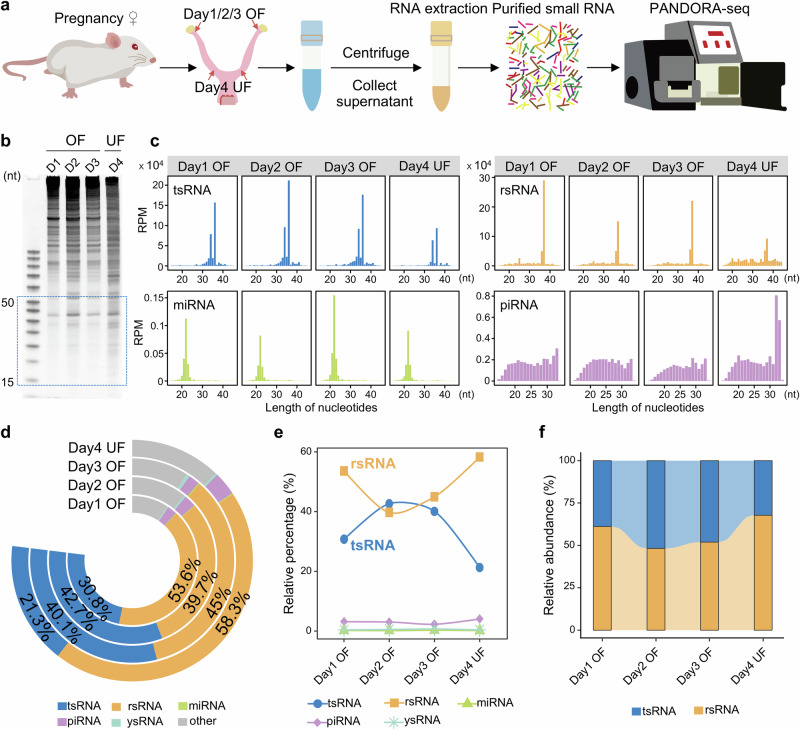
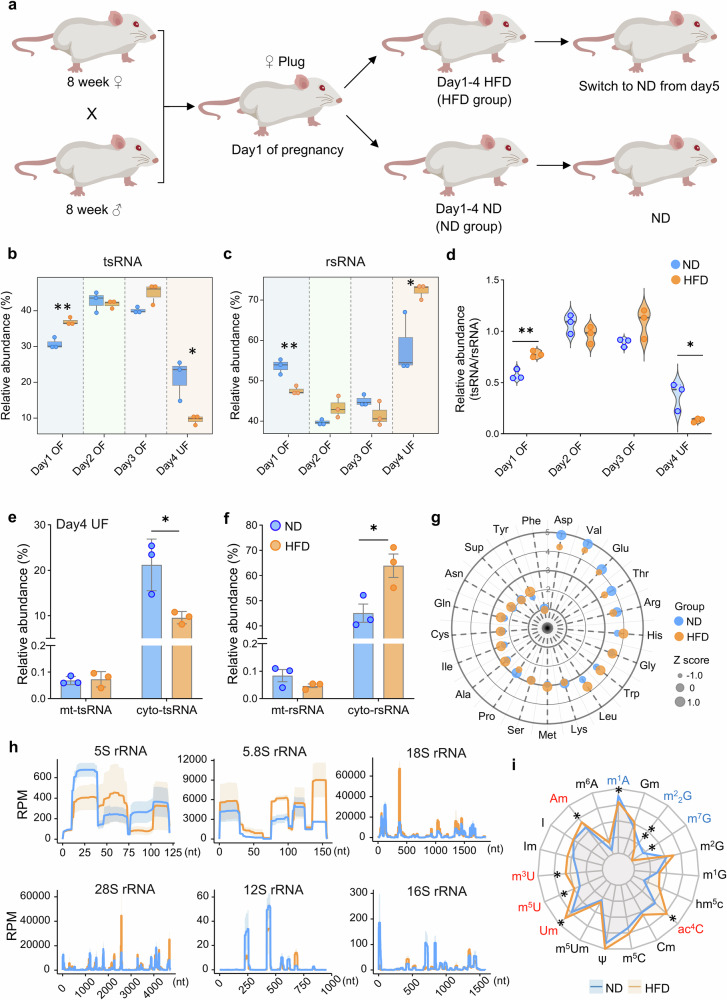
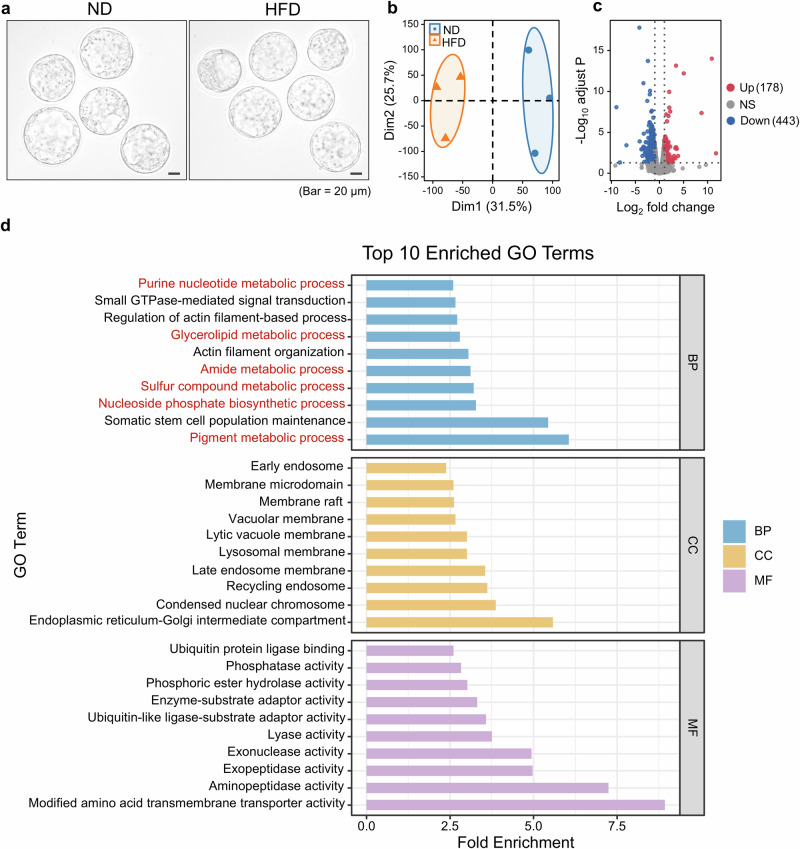
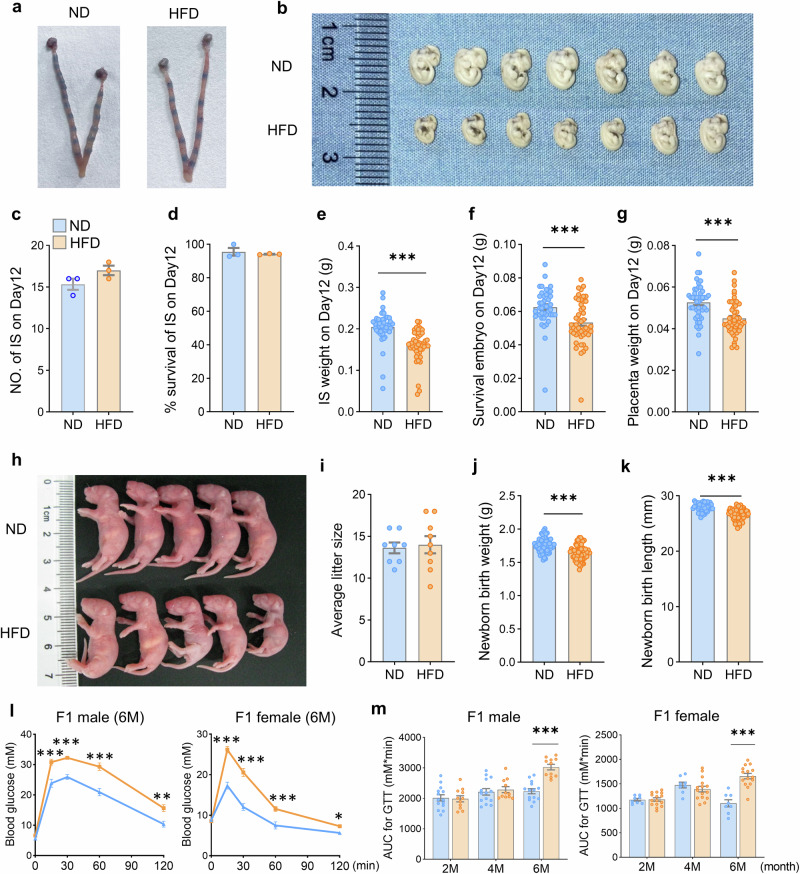
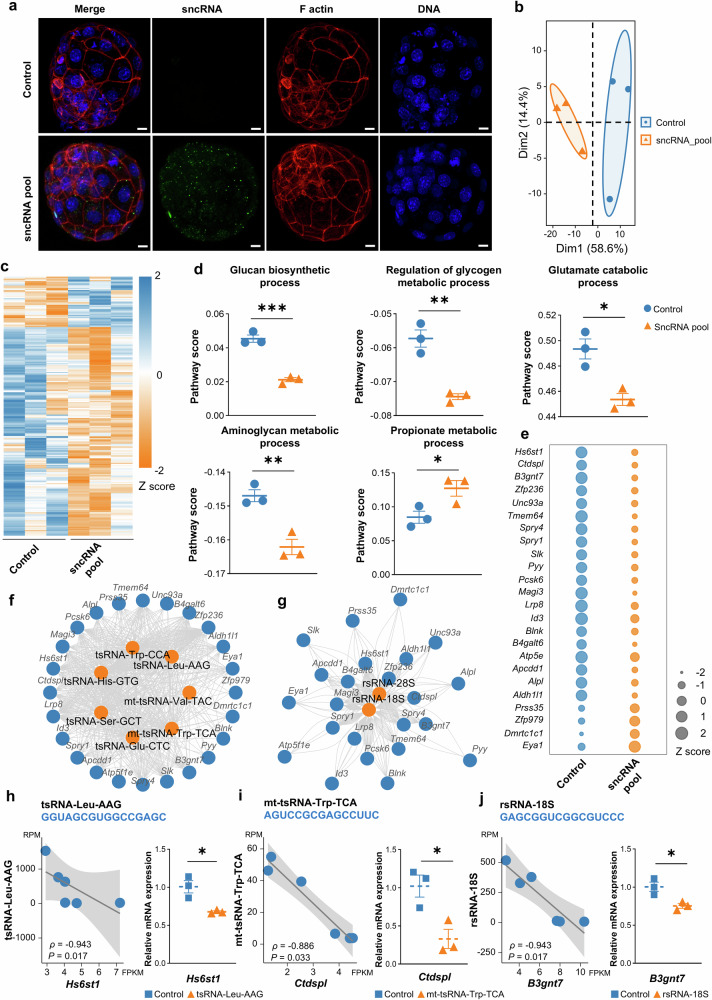
The periconception period is critical for embryo development, pregnancy outcomes, and offspring health. During this stage, oviductal and uterine fluids facilitate embryo-maternal interactions and support early embryonic development. Using PANDORA-seq, we identify a diverse repertoire of small non-coding RNAs in female mouse oviduct fluid and uterine fluid during preimplantation, with tRNA-derived small RNAs and rRNA-derived small RNAs being predominant. Maternal high-fat diet during preimplantation period significantly alters tsRNA and rsRNA expression in oviduct fluid and uterine fluid compared to normal diet, disrupting blastocyst metabolic gene expression. While implantation remained unaffected, these alterations impair mid-gestation embryonic and placental growth, resulting in reduced birth weight and length, as well as metabolic disorders in offspring. Furthermore, transfecting embryos with uterine fluid-derived sncRNAs altered by maternal high-fat diet mimics the in vivo effects. These findings suggest that tsRNAs and rsRNAs in reproductive fluids may reflect maternal metabolic status and transmit dietary information to the early embryo, which might influence pregnancy outcomes and offspring health.


Conflict of interest statement

Competing interests: The authors declare no competing interests.

Figures

Fig. 1
Fig. 1. sncRNA expression in mouse oviduct fluid (OF) and uterine fluid (UF).
a Schematic of detection process. b Views of small RNA expression in OF and UF by urea-PAGE gel, n = 3 biologically independent experiments. c Comparison of reads per million (RPM) and length distribution of different small non-coding RNA (sncRNA) categories in OF and UF. d Relative ratios of sncRNAs. e Changes of sncRNA expression throughout day 1 OF to day 4 UF. f Relative ratios of tRNA-derived small RNAs (tsRNAs) to rRNA-derived small RNAs (rsRNAs) throughout day 1 OF to day 4 UF. n = 3 biologically independent experiments, each using pooled samples from 4 mice. Statistical source data are provided in the Source Data file.
Fig. 2
Fig. 2. Preimplantation high-fat diet (HFD) exposure altered sncRNA expression in OF and UF.
a Schematic overview of the experimental workflow. bc Comparison of tsRNAs (b) and rsRNAs (c) expression in OF and UF under normal diet (ND) and HFD. Box plots display the median (center line), 25th and 75th percentiles (box bounds), and whiskers extending to the minimum and maximum values within 1.5× the interquartile range (IQR). Individual data points represent each sample and are overlaid as dots on the box plots, two-tailed Student’s t-tests, n = 3 biologically independent experiments, each using pooled samples from 4 mice. d Relative ratio of tsRNAs to rsRNAs in different OF and UF, two-tailed Student’s t-tests, n = 3 biologically independent experiments, each using pooled samples from 4 mice. ef Changes of mitochondrial and genomic tsRNAs (e) and rsRNAs (f), mt-tsRNA: mitochondrial tsRNA, cyto-tsRNA: genomic tsRNA, mt-rsRNA: mitochondrial rsRNA, cyto-rsRNA: genomic rsRNAs, two-tailed Student’s t-tests, n = 3 biologically independent experiments, each using pooled samples from 4 mice. g Changes of amino acid corresponds tRNA origins. h Changes of rsRNAs origin loci, RPM: Reads Per Million mapped reads. i Changes of UF RNA modifications in response to HFD exposure. The red font indicates upregulated RNA modifications, blue font indicates downregulated RNA modifications. n = 3 biologically independent experiments, each using pooled samples from 4 mice. The data represent means ± s.e.m. Two-tailed multiple t-tests, *P ≤ 0.05, **P ≤ 0.01. Statistical source data, precise P value and unprocessed blots are provided as in the Source Data file.
Fig. 3
Fig. 3. HFD exposure disrupts blastocyst metabolic gene expression.
a Representative morphology of blastocysts in ND and HFD groups, scale bar = 20 μm, n = 3 biologically independent experiments. b Principal component analysis (PCA) of transcriptome profiles of blastocysts in the ND and HFD groups. c Differential gene expression in blastocysts of ND and HFD groups. NS not significant. d Top 10 enriched Gene Ontology (GO) terms among significantly altered genes. The red font signifies the metabolic pathways. n = 3, BP Biological Process, CC Cellular Component, MF Molecular Function. Statistical source data and precise P value are provided as in the Source Data file.
Fig. 4
Fig. 4. Preimplantation exposure to maternal HFD induces intrauterine growth restriction and disrupts offspring metabolism.
a Representative images of implantation sites from dams fed either ND or HFD, n = 3 biologically independent experiments. b Representative images of embryos at embryonic day 12 from ND and HFD groups. c Quantification of the number of implantation sites at day 12 in both ND and HFD groups (n = 3 mice). d Comparison of embryo survival rates at day 12 between ND and HFD groups (n = 3 mice), IS: implantation sites. e Average weight of implantation sites at day 12 (ND: n = 46 implantation sites, HFD: n = 51 implantation sites), pooled from 3 dams per group. f Average weight of surviving embryos at day 12 (ND: n = 44 implantation sites, HFD: n = 48 implantation sites), pooled from 3 dams per group. g Average placental weight at day 12 (ND: n = 44 implantation sites, HFD: n = 48 implantation sites), pooled from 3 dams per group. h Representative images of newborn pups from the ND and HFD groups. i Average litter size at birth (ND: n = 8 dams, HFD: n = 9 dams). j Average body weight of newborn pups (ND: 67 pups from 5 dams, HFD: 59 pups from 5 dams). k Average length of newborn pups (ND: 42 pups from 3 dams, HFD: 67 pups from 4 dams). l Glucose Tolerance Test (GTT) results for 6-month-old male (left) and female (right) F1 offspring, M month. m GTT results represented as the area under the curve (AUC) for 2-, 4-, and 6-month-old male (left) and female (right) F1 offspring. ND-F1-male (n = 14 mice), HFD-F1-male (n = 11 mice), ND-F1-female (n = 8 mice), HFD-F1-female (n = 15 mice). Blue represents the ND group, and orange represents the HFD group. Two-tailed Student’s t-tests was used and data represent as mean ± s.e.m. *P ≤ 0.05, **P ≤ 0.01, ***P ≤ 0.001. Statistical source data and precise P value are provided as in the Source Data file.
Fig. 5
Fig. 5. Early embryo changes by transfecting changed sncRNAs.
a Representative images of blastocysts after transferring synthesized FAM-labeled sncRNAs (green). Scale bar = 10 μm, n = 3 biologically independent experiments. b PCA plot of blastocysts transfected with empty liposome (control) or sncRNA pool. c Expression heatmaps of genes in control and sncRNA pool transfected blastocysts. d Pathway changes after transfection, two-tailed Student’s t-tests, n = 3 biologically independent experiments. e Specifically changed genes. fg Predicted interactions between transfected tsRNAs (f) and rsRNAs (g) with changed genes. hj Significant correlations between sncRNAs in UF and altered genes within blastocysts, tsRNA-Leu-AAG and Hs6st1 (h), mt-tsRNA-Trp-TCA and Ctdspl (i), and rsRNA-18S and B3gnt7 (j), were detected by both correlation patterns analysis and individual sncRNAs transfection in NIH/3T3 cells, n = 3 biologically independent experiments. Two-tailed Student’s t-tests, and the data represent means ± s.e.m. *P ≤ 0.05, **P ≤ 0.01, ***P ≤ 0.001. Statistical source data and precise P value are provided as in the Source Data file.

Similar articles

References

    1. Barker, D. J., Forsen, T., Uutela, A., Osmond, C. & Eriksson, J. G. Size at birth and resilience to effects of poor living conditions in adult life: longitudinal study. BMJ. 323, 1273–1276 (2001). - PMC - PubMed
    1. Barker, D., Barker, M., Fleming, T. & Lampl, M. Developmental biology: support mothers to secure future public health. Nature504, 209–211 (2013). - PubMed
    1. Fleming, T. P. et al. Origins of lifetime health around the time of conception: causes and consequences. Lancet391, 1842–1852 (2018). - PMC - PubMed
    1. Velazquez, M. A., Fleming, T. P. & Watkins, A. J. Periconceptional environment and the developmental origins of disease. J. Endocrinol.242, T33–T49 (2019). - PubMed
    1. Schulz, K. N. & Harrison, M. M. Mechanisms regulating zygotic genome activation. Nat. Rev. Genet.20, 221–234 (2019). - PMC - PubMed

LinkOut - more resources