. 2025 Aug 16;16(1):622.
doi: 10.1038/s41419-025-07917-1.

Arginyltransferase1 drives a mitochondria-dependent program to induce cell death

Affiliations

Arginyltransferase1 drives a mitochondria-dependent program to induce cell death

Akhilesh Kumar et al. Cell Death Dis. .

Abstract

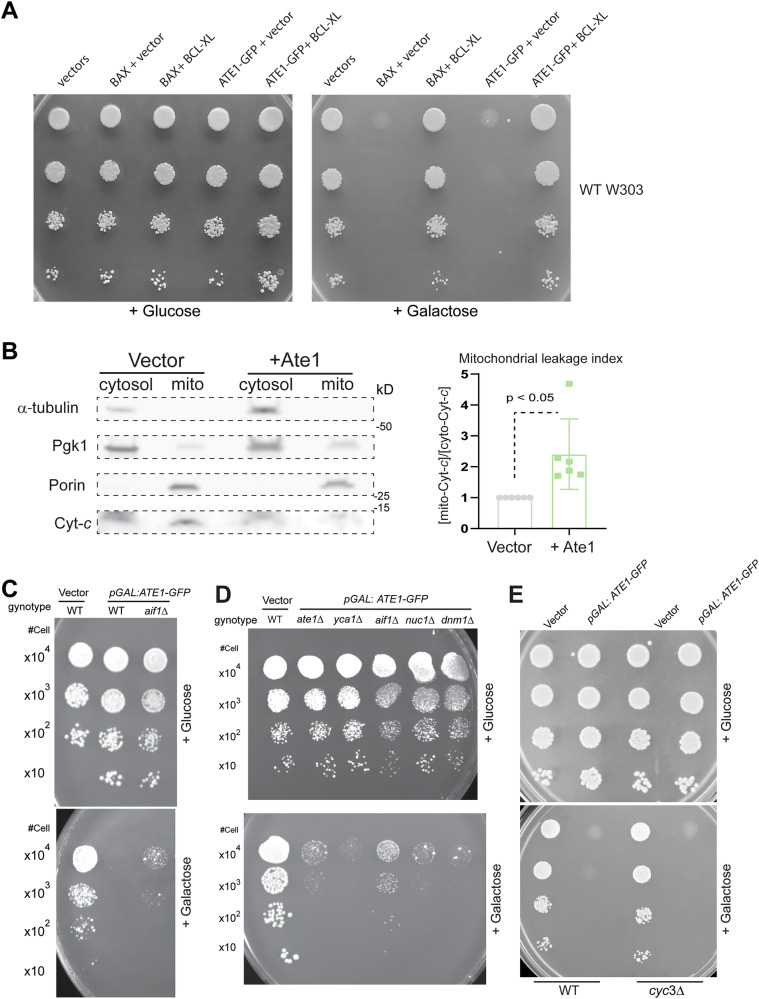
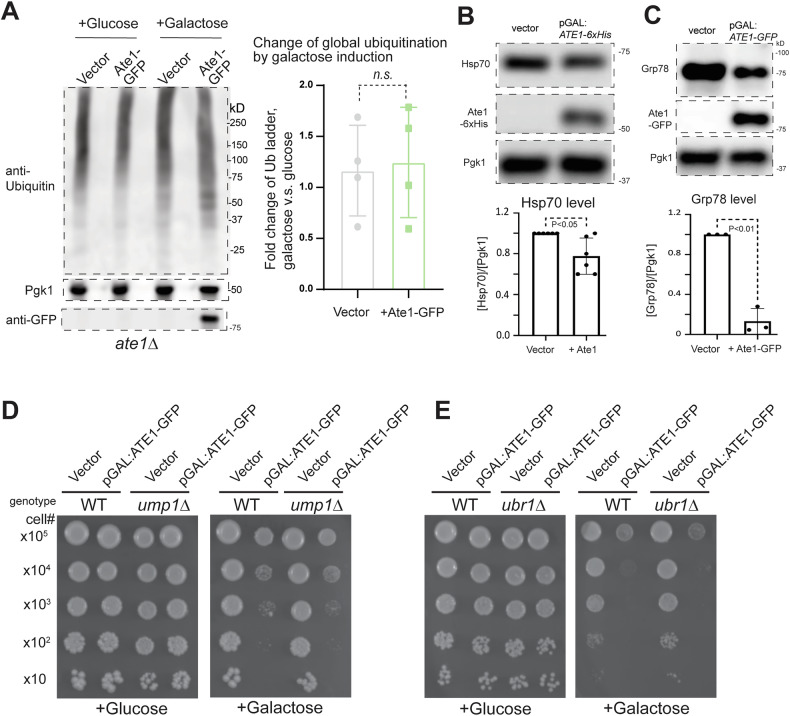
Cell death regulation is essential for stress adaptation and/or signal response. Past studies have shown that eukaryotic cell death is mediated by an evolutionarily conserved enzyme, arginyltransferase1 (Ate1). The downregulation of Ate1, as seen in many types of cancer, prominently increases cellular tolerance to a variety of stress conditions. Conversely, in yeast and mammalian cells, Ate1 is elevated under acute oxidative stress conditions, and this change appears to be essential for triggering cell death. However, studies of Ate1 were conventionally focused on its function in inducing protein degradation via the N-end rule pathway in the cytosol, leading to an incomplete understanding of the role of Ate1 in cell death. Our recent investigation shows that Ate1 dually exists in the cytosol and mitochondria, the latter of which has an established role in cell death initiation. Here, by using budding yeast as a model organism, we found that mitochondrial translocation of Ate1 is promoted by the presence of oxidative stressors, and this process is essential for inducing cell death preferentially through the apoptotic pathway. Also, we found that Ate1-induced cell death is dependent on the formation of the mitochondrial permeability transition pore and at least partly dependent on the action of mitochondria-contained factors, including the apoptosis-inducing factor, but is not directly dependent on mitochondrial electron transport chain activity or reactive oxygen species (ROS) derived from it. Furthermore, our evidence suggests that, contrary to widespread assumptions, the cytosolic protein degradation pathways, including ubiquitin-proteasome, autophagy, or endoplasmic reticulum (ER) stress response, has little or negligible impacts on Ate1-induced cell death in the tested conditions. We conclude that Ate1 controls the mitochondria-dependent cell death pathway.


Conflict of interest statement

Competing interests: The authors declare no competing interests. Ethics approval and consent to participate: This published article contains data derived from the usage of recombinant DNAs. All related methods were performed in accordance with the relevant guidelines and regulations, approved by the Institutional Biosafety Committee with the protocol number IBC #21-062.

Figures

Fig. 1
Fig. 1. Visualization of Ate1 colocalization with mitochondria upon treatments of oxidative stressors.
A Representative fluorescence microscopic images showing the signal of Ate1 tagged with a C-terminal GFP, which is driven by the endogenous ATE1 promoter at the native chromosome locus. The yeast cells were either treated with 5 mM H2O2 or 5% NaN3, or not treated with anything (nonstress). The observation started promptly within 5 min of treatments. The BY4741 strain yeast was used for tests in all figures unless otherwise indicated. B The above-mentioned Ate1-GFP expressing yeast cells were treated with stressors H2O2 (5 mM) and stained with mitochondria-specific dye Mitoracker-Red. Arrow point to several locations where obvious colocalization of the green and red fluorescent signals are observed. C To quantify the mitochondrial translocation of the above-mentioned Ate1 under stressing conditions, Pearson colocalization coefficient analysis was used to measure the relative colocalization of GFP tagged Ate1 and mitochondria-specific dye (Mitotracker-red) in non-stressing and stressing conditions, using randomly selected microscopy images for regions of interest contains at least 50 cells for each (n = 6 and 10 for the non-treated and H2O2 treated groups). As in elsewhere in this study, unless otherwise indicated, the error bars represent standard deviation (S.D.), and the p values were calculated by two-tailed student t-test.
Fig. 2
Fig. 2. Oxidative stress induced by NaN3 increases mitochondrial Ate1 localization.
A Left panel: representative Western blot (WB) showing total levels of Ate1-GFP in W303 wild-type strain treated either with or without 5%NaN3 for 30 min. The Ate1-GFP was cloned in a pYES2 vector with Galactose-inducible promoter (pGAL). The same construct was used elsewhere in this study unless otherwise indicated (such as in Fig. 1). To avoid acute cell death, the expression was induced by switching to culture media containing a moderate concentration of galactose (0.5%) and incubated for 3 h at 30 °C. Empty vector serves as a negative control. Alpha tubulin is used for protein loading control. Right panel: quantification of the total Ate1 levels in the cells treated with or without 5%NaN3 for 30 min with alpha tubulin as the loading control and normalized to the group without the NaN3 treatment (n = 3). B Left panel; representative Western blot showing Ate1-GFP levels in purified mitochondrial fractions, which was treated with proteinase K (5 μg/ml) to remove proteins that are not protected by the mitochondrial membrane. Alpha-tubulin is used as a marker for cytosolic protein contamination, while mitochondrial intermembrane space protein Cmc2 serves as a marker for mitochondrial proteins. Right panel: showing the quantification of mitochondrial Ate1-GFP levels normalized to mitochondrial protein Cmc2 (n = 3).
Fig. 3
Fig. 3. The mitochondrial translocation of Ate1 is essential for the cell death induced by Ate1 over-expression.
A The left panel shows yeast cells containing Ate1-GFP and Ate1-GFP-Ras2, which were allowed to express for 6 h with 2% galactose induction and then briefly treated with oxidative stressor H2O2 for 10 min before the microscopic images were taken. The regular Ate1-GFP forms puncta-like structures, similar as shown in Fig. 1, while Ate1-GFP-Ras2 remains localized to the periphery of the cells. The right panel shows quantitative measurement of the distribution of the GFP signal. This was done by calculating the ratio of the mean GFP signal from the plasma membrane (using profile method on Zeiss ZenBlue software; stroke = 1 pixel width) versus the mean GFP throughout the whole cell (on 10 randomly chosen individual yeast cells). Homoscedasticity was determined via Levene’s test, before being analysed via a two-tailed Student’s t-test (n = 10). Error bars represent S.D. B Scheme illustrating the principle of the reporter for the arginylation activity inside yeast cells. The N-terminal ubiquitin domain of the reporter protein DD-β15-mCherryFP will be promptly removed by endogenous de-ubiquitination (de-Ub) enzymes in the cell, exposing the penultimate peptide DD-β15, which is derived from the N-terminus of mouse β-actin and is known to be arginylated in vivo [9, 39]. The arginylated N-terminus can be recognized with a specific antibody anti-RDD [9]. Antibodies for mCherryFP (mChFP) and GFP can be used to probe the levels of the reporter protein and the GFP-fused ATE1, respectively. C To test the arginylation activity of different forms of Ate1 (Ate1-GFP or Ate1-GFP-Ras2), they were expressed in ate1Δ yeast (to avoid the interference of endogenous ATE1), which was also simultaneously expressing the reporter protein DD-β15-mCherryFP. The arginylation level of the reporter protein was measured as described in (B). To avoid potential carryover of antibody signals, the same set of samples were loading twice in different gels for the probing of anti-RDD and anti-mCherry, separately. Pgk1 serves as loading controls for the yeast proteins. The left panel shows representative WB images while the right panel shows quantification from multiple repeats (n = 4). D Growth test of ate1Δ yeast cells carrying either the empty expression vector, or the one containing Ate1-GFP or Ate1-GFP-Ras2 was conducted by a serial dilution growth assay on either plate containing glucose or galactose, where the expression of Ate1 is not induced or induced, respectively. E The left panel shows representative Western blots showing the expression of different Ate1 constructs in total cell lysate. The level of Ate1 was probed by its GFP fusion tag and Pgk1 was used as a loading control. The employed Ate1 constructs include the original Ate1-GFP as control (labelled as “cont”), and the forms that are expected to be targeted to the mitochondrial matrix (Mt) or mitochondrial intermembrane space (IMS). The IMS- and Mt- targeting sequences were derived from S. cerevisiae Cytochrome b2 (Cyb2) with or without a deletion of a 19 amino acid(Aa) stop-transfer transmembrane signal as described in published studies [40, 41, 74]. To avoid disrupting mitochondria, the expression of these different Ate1 constructs was achieved by adding 0.5% galactose and incubated for 3 h at 30 °C. The signal of the GFP-fused Ate1 were probed by anti-GFP with Pgk1 as loading controls for total proteins. The right panel shows quantification (n = 6). F Similar to (E), except that the mitochondrial-specific fractions, treated with proteinase K to remove any proteins attached on the outside, were used to prepare the lysates for the measurement of the levels of Ate1 inside mitochondria, with Cmc2 as the loading controls for mitochondrial proteins. The right panel shows quantification (n = 3). G Growth test of WT W303 yeast cells carrying either the empty expression vector, Ate1-GFP (cont-), the matrix localized Ate1-GFP (Mt-), or the IMS located Ate1-GFP (IMS-) by a serial dilution growth assay on either plate containing galactose or glucose for the induced expression (or not) of Ate1. Note that the concentration of galactose (0.5%) is lower and the cell loading were higher than elsewhere to allow the display of the difference between the different forms of Ate1. Plates were incubated at 30 °C and images were taken after 3 days.
Fig. 4
Fig. 4. Ate1-overexpression triggers cell death events with characteristics of apoptosis.
A Representative microscopy images displaying the presence of DNA fragmentations probed by the TUNEL assay. The ate1Δ yeasts were transformed with a plasmid vector (pYES2) containing Ate1 driven by a galactose-inducible promoter (pGAL). To avoid introducing additional fluorescence, a C-terminal 6 × His tag was used and the construct is termed (pGAL: ATE1-6 × His). As a control, the empty vector was used. The induction was performed by switching to a selection media containing 2% galactose for 20 h (hr, or h). The panels on the left display only the TUNEL signal (green fluorescence), while the panels on the right are an overlay of TUNEL and Differential Interference Contrast (DIC) microscopic images. The yellow scale bars represent a length of 10 μm, which is similarly used in other images in this study unless otherwise indicated. B Quantification of the frequencies of TUNEL-positive cells described in (A) based on 3 randomly selected (n = 3) microscopy images with at least 200 cells in each image. C Similar as (A), except that fluorescently labelled Annexin-V (green) was used to stain cells with apoptotic signs, and that the wild-type yeasts were used. On the top panel are yeasts with the empty vector or Ate1-6 × His, which were induced by 2% galactose for 6 h. On the bottom, yeasts treated with 10 mM H2O2 for 200 min was used as a positive control for apoptotic signals. D Quantification of the percentage of cells described in (C) that are negative or positive of Annexin V signals. The analysis is based on 3 randomly selected microscopy images (n = 3) with at least 70 cells in each image.
Fig. 5
Fig. 5. Ate1-overexpression have no major effects on necrosis or autophagy.
A Top panel displays representative cropped microscopy images of DIC channel showing the location and morphology of the yeasts, the red fluorescence channel showing the signal of Propidium iodide (PI) staining, or the merged images. The BY4741 WT yeasts were either untreated or treated with 200 mM acetic acid for 200 min as a positive control to induce necrosis. Bottom panel displays corresponding images of ate1∆ cells harbouring Ate1-6 × His in the pYES2 vector, which is driven by a galactose-inducible promoter (“pGAL: ATE1-6 × His”). As a control, the empty vector (“pGAL”) was used. The induction was performed with 2% galactose for 6 h, 24 h, or not induced (0 h). The rates of PI-positive and negative cells in these cells are shown in the bar graph on the right side, which was calculated based on analysis of 3 randomly chosen microscopy images (full-size, uncropped) for each sample groups (n = 3). Each image contains at least 100 cells. Error bar denotes standard error of means (SEM). B Similar as in (A) except the BY4741 wild type yeast cells harbouring a constitutive expression vector for Nhp6A-GFP (PESC-LEU-NHP6A-GFP) was used. On the top panel, the pink arrow in the untreated cells indicates a representative location where the Nhp6A-GFP is enriched in a focal point. The white arrow in the acetic acid treated cells points to a cell where the Nhp6A-GFP appears to be diffusive, indicating necrosis. On the bottom panel, the Nhp6A-GFP containing cells are co-transformed with either the galactose-inducible Ate1 (pGAL: Ate1-6 × His) or the empty vector (pGAL). The induction with 2% galactose was performed for either 6 or 24 h or not (0 h). Yeast nuclei were stained with DAPI. The graph on the right side shows percentages of cells showing nuclear localization or diffusive distribution of NHP6A-GFP, which was calculated from 3 randomly chosen microscopy images (full-size, uncropped) for each sample groups (n = 3). Each image contains at least 100 cells. Error bar denotes standard error of means (SEM). C Top panel: representative WB images of wild-type yeast cells (BY4741) carrying the autophagic reporter GFP-Atg8 either with empty plasmid vector (vec) or the one carrying galactose-inducible Ate1-6 × His. The induction was initiated by switching from raffinose-containing media (0 h) to 2% galactose-containing media for 6 or 22 h. The levels of the full-length GFP-Atg8 and the cleavage product (GFP) were probed by anti-GFP while Pgk1 was used as a loading control. The graph on the bottom panel shows the fold differences in cleavage ratio between the full-length GFP-Atg8 and the cleaved GFP (n = 3). See also Suppl Fig. S1A for the positive control of yeast treated with rapamycin to induce a high level of cleavage on GFP-Atg8. D Growth test of WT or atg1Δ yeast cells carrying either Ate1-GFP driven by the galactose promoter or the empty vector (“Vec”) by a serial dilution growth assay on either plate containing galactose or glucose. Note that the growths of atg1Δ and the WT yeasts have intrinsic difference on the galactose media. Therefore, to accurately compare the growth difference specifically induced by Ate1, the exposures of these two strains were taken differently so that the cells with the vector control show similar growth.
Fig. 6
Fig. 6. Ate1-induced cell death involves mitochondrial permeabilization transition pore.
A A diagram showing some of the key components in yeasts that affect mitochondrial permeabilization transition pore (mPTP) and apoptosis. Note that the Bcl-XL is not an endogenous protein of yeast, but it can interact with the mitochondrial outer membrane permeabilization (MOMP) event [56]. B Growth of yeast cells (WT, aac1Δ, aac2Δ¸ aac3Δ, all on W303 strains) carrying either the empty expression vector (vector) or pGAL1:ATE1-GFP (+Ate1-GFP) was measured by a serial dilution growth assay on either plate containing 2% glucose or 2% galactose, where the expression of Ate1 is not induced or induced, respectively. Plates were incubated at 30 °C and images were taken after 2–3 days. C Similar to (B), except that WT and mir1Δ yeasts were used. D Serial dilution growth assay to assess changes in growth of WT yeast induced with pGAL: Ate1-GFP in the context of various ATP synthase inhibitors. Yeasts were grown in raffinose-containing liquid media before being washed, serially diluted in H20, and plated to either glucose or galactose-containing plates with the designated concentrations of inhibitors, including Oligomycin A, Quercetin, and α-ketoglutarate (α-KG). Plates were allowed to grow three days before images were taken. DMSO (at a final concentration of 0.004% in the plate) was used as vehicle control. See also Suppl Fig. S1B to see the equal growth rate of the involved mutant yeast strains carrying the empty vector on galactose-containing media, compared to the WT strain.
Fig. 7
Fig. 7. Ate1-induced cell death involves mitochondrial outer membrane permeabilization.
A Growth of yeast cells (W303 strain, WT) carrying either the empty expression vectors (pYES2-URA3 and pBF339-TRP1 vectors), or the galactose-inducible mouse BAX (pBM272-pGAL-BAX-URA3) and yeast Ate1 (pYES2-pGAL-ATE1-GFP-Ura3) in the presence of constitutively expressing Bcl-xL (pBF339-ADH-BCLxL-TRP1) or the vector (pBF339-TRP1) was measured by a serial dilution growth assay on either plate containing 2% glucose or 2% galactose, where the expression of Ate1 or BAX is not induced or induced, respectively. Plates were incubated at 30 °C and images were taken after 3 days. B Representative Western blots displaying changes in the distribution of cytochrome c (Cyc) between mitochondria and cytosol in yeast cell where Ate1-6 × His was induced for expression (“+Ate1”) with 2% galactose in Ura-minus liquid media for 6 h at 30 °C. The separated cytosolic fraction and mitochondrial fraction were compensated by buffer to be equal volume before analysis. Alpha-tubulin and Porin (VDAC) were used as markers to display the purity of cytosolic and mitochondrial fractions, respectively. Pgk1 was used as an additional loading control. The quantification of the blot was based on n= 6; error bars represent S.E.M. C Growth of yeast cells (WT or aif1Δ) carrying either the empty expression pYES2 vector (“Vector”) or pYES-pGAL1:ATE1-GFP (“+Ate1-GFP”) was measured by a serial dilution growth assay on either plate containing 2% glucose or 2% galactose, where the expression of Ate1 is not induced or induced, respectively. Plates were incubated at 30 °C and images were taken after 3–5 days. D Similar to (C), except that WT, aif1Δ, ate1Δ¸ yca1Δ, nuc1Δ, and dnm11Δ) yeasts were used. E Similar to (C), except that WT and cyc3Δ yeasts were used. See also Suppl Fig. S1C to see the equal growth rate of the involved mutant yeast strains carrying the empty vector on galactose-containing media compared to the WT strain, if they were not already shown in this figure.
Fig. 8
Fig. 8. The mitochondrial respiratory activity is not directly required during Ate1-driven cell death.
A The mitochondrial membrane potentials in yeast cells, WT or rip1Δ, were probed by staining dyes Mitotracker-red (red). White arrows point to representative locations with high intensities. B Left panel shows representative microscopy images of mitochondrial membrane potentials in WT or rip1Δ yeasts measured by rhodamine 123 (green). White arrows point to selected locations with high intensities. Right panel shows the corresponding quantification. The relative membrane potential was calculated by dividing the maximum fluorescence intensity by the mean intensity. The data was determined as heteroscledastic via Levene’s test, before being analysed via student’s t-test. 10 randomly chosen yeast cells were included in each group (n = 10). C Growth of yeast cells (WT or rip1Δ) carrying either the empty expression vector pYES2 (“Vector”) or pYES2-pGAL1:ATE1-GFP (“+Ate1-GFP”) was measured by a serial dilution growth assay on either plate containing 2% glucose or 2% galactose, where the expression of Ate1 is not induced or induced, respectively. Plates were incubated at 30 °C and images were taken after 3–5 days. D Similar to (C), except that ndi1Δ was used. E Similar to (C), except that nde1Δ was used. See also Suppl Fig. S1D to see the equal growth rate of the involved mutant yeast strains carrying the empty vector on galactose-containing media compared to the WT strain, if they were not already shown in this figure.
Fig. 9
Fig. 9. Mitochondrial ROS is not directly required during the Ate1-driven cell death.
A Representative flow cytometry plots depicting mitochondrial ROS levels at indicated timepoints after galactose induction. The yeast cells contain either the empty vector control pYES2 (black) or the pYES2-ATE1-6 × His for the overexpression of the 6 × His tagged Ate1 (red). MitoSOX Red was used to stain for mitochondrial ROS, and samples were excited with a 488 nm blue laser and emission was measured using a 585 nm filter with a 42 nm bandpass. No obvious differences in mitochondrial ROS were noted between Ate1 and control samples, in any of the time points. B Graph shows the fold-changes of mRNA levels of yeast SOD1 and SOD2, measured by quantitative PCR in ate1Δ yeast cells carrying the combination of different vectors. These include the two empty expression vectors pYES2-URA (pGAL), and pGPD2-Leu2 (pGPD), the pYES2 vector containing Ate1-GFP (“pGAL:ATE1-GFP”), pGPD2 vector containing yeast SOD1 (“pGPD:SOD1”) or SOD2 (“pGPD:SOD2”). The loading was normalized by the level of ACT1 mRNA. The fold-change was calculated relative to the group containing two empty vectors (n = 3). C Top panel shows representative WB images for the level of yeast SOD1 and SOD2, in ate1Δ yeast cells carrying a pYES2 vector containing Ate1-GFP (“pGAL:ATE1-GFP”) and the combination of either a pGPD2 vector containing yeast SOD1 (“pGPD:SOD1”) or SOD2 (“pGPD:SOD2”), or the empty vector pGPD2-Leu2 alone (“pGPD vector”). The yeasts were grown in the glucose-containing media, where the constitutive GPD promoter should be active. Pgk1 was used as a loading control. The fold-change was calculated relative to the group containing the pGPD vector (n = 3). D Growth of ate1Δ yeast cells carrying either the empty expression vectors pYES2-URA + pGPD2-Leu2 (vectors), pYES2-pGAL1:ATE1-GFP + pGPD2-Leu2 (n/a), or pYES2-pGAL1:ATE1-GFP in the presence of constitutively expression vectors of pGPD2-SOD1-Leu2 or pGPD2-SOD2-Leu2 (+SOD1, or +SOD2). The growth rate was measured by a serial dilution growth assay on Ura-minus, Leu-minus SD plates containing 2% glucose or 2% galactose, where the expression of Ate1 is not induced or induced, respectively. Plates were incubated at 30 °C and images were taken after 3 days.
Fig. 10
Fig. 10. Ate1-overexpression does not lead to elevation of global ubiquitination and Ate1-induced cell death is not directly dependent on the functions of the ubiquitin-proteasome system.
A Left panel displays representative Western blots depicting global ubiquitination levels in ate1Δ yeast with either pGAL:ATE1-GFP or empty vector, which were induced for 6 h with 2% galactose in liquid media. The level of Ate1-GFP was probed with anti-GFP. Pgk1 was used as a loading control. The right panel display quantification of the fold-change of total ubiquitin ladder signals by switching from glucose to galactose media (with raffinose media as a transition condition), which was normalized by Pgk1 loading. A p value > 0.05 is considered nonsignificant “n.s.” (n = 4). B Representative Western blot showing the expression levels of cytosolic stress response protein HSP70 in the yeast cells carrying the pYES2-pGAL:ATE1-6×His-URA3 expression vector or the empty control vector, which were induced with 2% galactose for 6 h in liquid media. The level of Ate1 was probed with antibody against 6 × His tag. The lower panel shows the densitometric analysis of the cytosolic Hsp70 levels as expressed in fold difference after normalization to the internal protein loading control Pgk1 (n = 6). C Similar to (B), except that the level of Grp78/HDEL, a maker of the endoplasmic reticulum unfolded protein stress response, was shown. The quantification was based on 3 independent repeats (n = 3). D Growth assay of WT or ump1Δ yeast carrying either pYES2-pGAL:ATE1-GFP-URA3 or empty vector. The growth was measured by a serial dilution growth assay on Ura-minus SD plates containing 2% glucose or 2% galactose, where the expression of Ate1 is non-induced or induced, respectively. Plates were incubated at 30 °C and images were taken after 3 days. E Similar to (D), except that ubr1Δ was used to compare to WT yeasts.

Update of

Similar articles

References

    1. Kaji H, Novelli GD, Kaji A. A soluble amino acid-incorporating system from rat liver. Biochim Biophys Acta. 1963;76:474–7. - PubMed
    1. Bachmair A, Finley D, Varshavsky A. In vivo half-life of a protein is a function of its amino-terminal residue. Science. 1986;234:179–86. - PubMed
    1. Varshavsky A. The N-end rule pathway and regulation by proteolysis. Protein Sci. 2011;20:1298–1345. - PMC - PubMed
    1. Chakraborty G, Leach T, Zanakis MF, Ingoglia NA. Posttranslational protein modification by amino acid addition in regenerating optic nerves of goldfish. J Neurochem. 1986;46:726–32. - PubMed
    1. Shyne-Athwal S, Riccio RV, Chakraborty G, Ingoglia NA. Protein modification by amino acid addition is increased in crushed sciatic but not optic nerves. Science. 1986;231:603–5. - PubMed

MeSH terms

Substances

LinkOut - more resources