. 2025 Aug 16;8(1):1235.
doi: 10.1038/s42003-025-08685-6.

Dynamic brain-heart interaction in sleep characterized by variational phase-amplitude coupling framework

Affiliations

Dynamic brain-heart interaction in sleep characterized by variational phase-amplitude coupling framework

Juntong Lyu et al. Commun Biol. .

Abstract

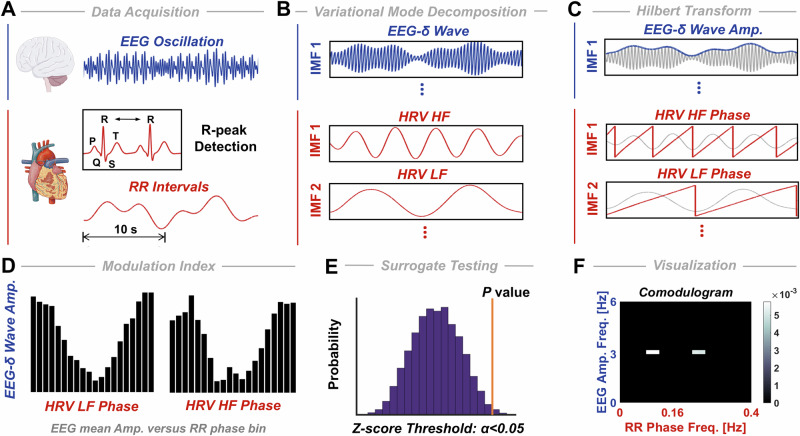
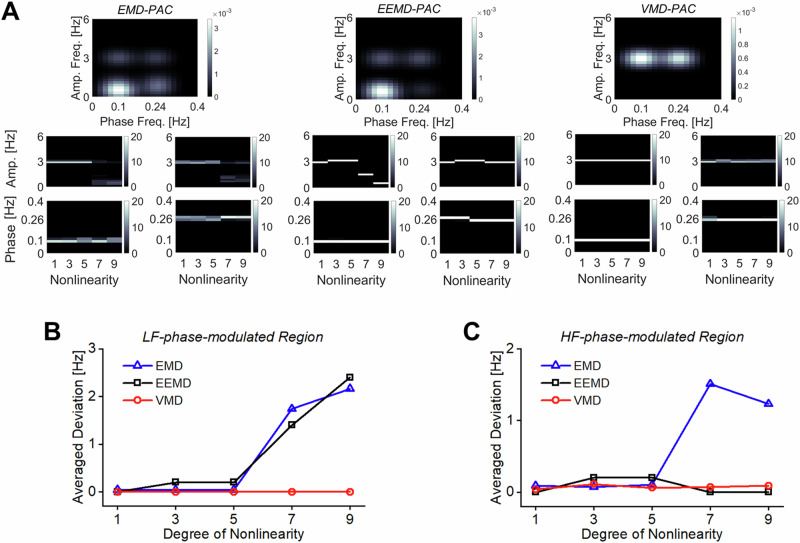
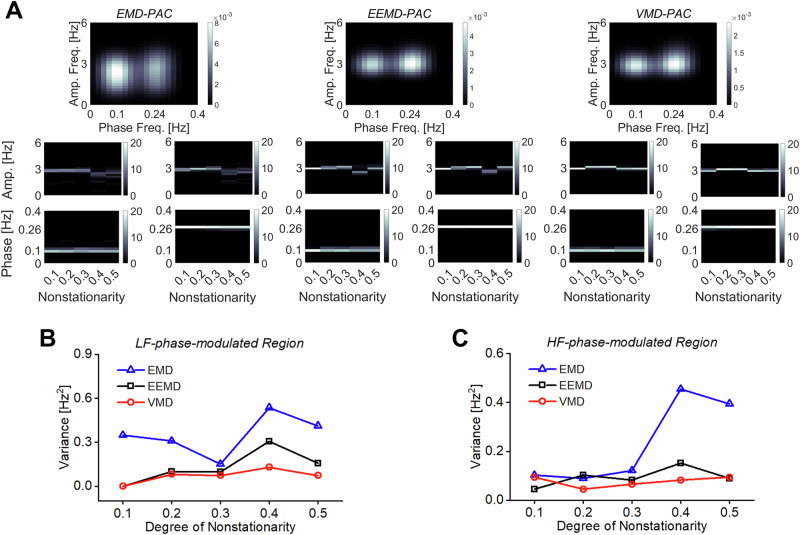
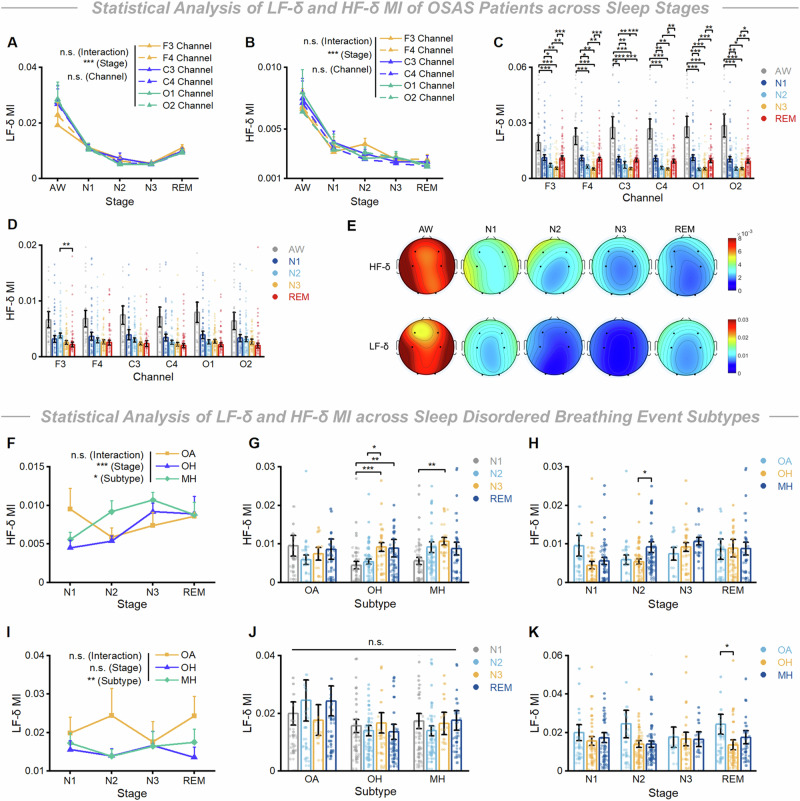
Sleep is a complex physiological state characterized by synchronized cortical and cardiac oscillations, which reflect dynamic communication and interaction between the central (CNS) and autonomic (ANS) nervous systems, crucial for maintaining homeostasis and overall health. However, the dynamic interplay between CNS and ANS rhythmicities in sleep remains unclear. Here, we present a variational phase-amplitude coupling framework that associates frequency modulations of the electroencephalogram and cardiac R-peak intervals across sleep dynamics. We validate the robustness of our method on spurious couplings by nonlinear or nonstationary simulations. Moreover, delta-range slow cortical oscillations exhibit robust coupling with both the low- (HRV-LF) and high-frequency (HRV-HF) constituents of RR-interval heart-rate variability, thereby constituting a cardinal electrophysiological signature of ANS-CNS modulation. Furthermore, we highlight the significance of the "decoupling phenomenon" in a transitional period from wake to sleep for sleep preparation, and discover stronger couplings between the HRV-LF component and EEG-δ wave, and weaker couplings between the HRV-HF component and EEG-δ activity for obstructive sleep apnea (OSA) patients compared to healthy individuals, and finally uncover the key patterns of brain-heart interaction in both healthy cohorts and OSA patients during sleep.


Conflict of interest statement

Competing interests: The authors declare no competing interests.

Figures

Fig. 1
Fig. 1. Schematic diagram of heart-brain variational phase-amplitude coupling framework.
A The data acquisition procedure. EEG and ECG are directly acquired from the polysomnography (PSG) equipment. R-peaks are extracted from ECG signals, and the RR interval time series is constructed from continuous adjacent R-peaks. B Decompose EEG (in blue) and RR intervals (in red) time series into intrinsic mode functions (IMFs). EEG oscillations are decomposed into IMFs in several spectral sub-bands, such as δ (0.5 ~ 4 Hz), θ (4 ~ 8 Hz), α (8 ~ 13 Hz), and β (13 ~ 30 Hz); while RR intervals are decomposed into mainly LF (0.04 ~ 0.15 Hz) and HF (0.15 ~ 0.4 Hz) sub-bands of heart rate variability (HRV). C Perform Hilbert transform on IMFs of EEG and RR intervals to obtain instantaneous amplitudes and phases, respectively. D Calculate modulation index between the instantaneous phase and amplitude time series derived from IMFs of EEG and RR intervals. E Generate surrogate data to perform permutation testing on MI. The z-score threshold is set at α < 0.05. F Visualize heart-brain variational phase-amplitude coupling results in a phase-amplitude frequency plane. Figure components incorporate illustrations from Servier Medical Art (CC BY 4.0).
Fig. 2
Fig. 2. Comparison of robustness assessment in nonlinear coupled signals with existing methods.
A The PAC results of VMD, EEMD, and EMD methods in the anti-nonlinearity experiment. The upper panel demonstrates the average comodulogram from 20 realizations of a signal with amplitude-giving oscillation having a degree of nonlinearity of 9, obtained with the three methods. The lower panel shows histograms of the phase and amplitude frequency bins at which the maximum PAC is observed, at all levels of nonlinearity, in both LF (0.04 ~ 0.15 Hz) and HF (0.15 ~ 0.4 Hz) phase-modulated regions of comodulogram, and for all three methods. B The average deviation of the amplitude frequency of the maximum MI from the pre-set 3 Hz in the LF-phase-modulated region of comodulogram. C The average deviation of the amplitude frequency of the maximum MI from the pre-set 3 Hz in the HF-phase-modulated region of comodulogram.
Fig. 3
Fig. 3. Comparison of robustness assessment in nonstationary coupled signals with existing methods.
A The PAC results of VMD, EEMD, and EMD methods in the anti-nonstationarity experiment. The upper panel demonstrates the average comodulogram from 20 realizations of a signal with amplitude-giving oscillation having a degree of nonstationarity of 0.5, obtained with the three methods. The lower panel shows histograms of the phase and amplitude frequency bins at which the maximum PAC is observed, at all levels of nonstationarity, in both LF (0.04 ~ 0.15 Hz) and HF (0.15 ~ 0.4 Hz) phase-modulated regions of comodulogram, and for all three methods. B The variance of the amplitude frequency of the maximum MI in the LF-phase-modulated region of comodulogram from 20 realizations. C The variance of the amplitude frequency of the maximum MI in the HF-phase-modulated region of comodulogram from 20 realizations.
Fig. 4
Fig. 4. Empirical validation of instantaneous HRV-LF and HRV-HF indices.
A An example of the simulated RR interval time series. B Comparisons between time-resolved HRV-LF markers derived from WVD and VMD methods. CSI serves as the ground truth of sympathetic activity. The indices of CSI, WVD-LF, and VMD-LF were z-score normalized at the time level. C Comparisons between time-resolved HRV-HF markers derived from WVD and VMD methods. CPI serves as the ground truth of parasympathetic activity. The indices of CPI, WVD-HF, and VMD-HF were z-score normalized at the time level. D Spearman correlations between CSI and WVD-LF, as well as CSI and VMD-LF. Two-pair Wilcoxon signed-rank test was implemented on the VMD and WVD groups. (n = 20; Z = −1.1760; P = 0.2455). E Spearman correlations between CPI and WVD-HF, as well as CPI and VMD-HF. Two-pair Wilcoxon signed-rank test was implemented on the VMD and WVD groups. (n = 20; Z = −3.7893; ***P < 0.0001).
Fig. 5
Fig. 5. Heart-brain variational phase-amplitude coupling framework applied to monitoring dynamic BHI in healthy sleep.
A Topoplots of the average MI of the two frequency pairs across sleep stages. B The LF-δ MIs of six channels across five sleep stages. (Two-way ART-ANOVA, interaction: P = 0.6656, stage: ***P < 0.0001, channel: P = 0.2856) C The HF-δ MIs of six channels across five sleep stages. (Two-way ART-ANOVA, interaction: *P = 0.0342, stage: ***P < 0.0001, channel: ***P = 0.0007) DE Comparisons of LF-δ and HF-δ MIs of six channels across five sleep stages in healthy subjects (n = 72). D One-way ART-ANOVA was implemented in each channel subgroup with Tukey’s post-hoc multiple comparisons tests on LF-δ MIs. E Two-way ART-ANOVA with Tukey’s post-hoc multiple comparisons tests on HF-δ MIs. F Variational heart-brain phase-amplitude coupling characterizes evolving modalities in the transition of sleep for healthy individuals. During the awake state, sympathetic activity plays a dominant role in sympathovagal balance, which potentially leads to increases in LF power. During the transitional state (N1 stage), the fluctuations of ANS and CNS break the connection between brain and heart, resulting in a decoupling phenomenon (both LF-δ and HF-δ coupling strength stay at low levels). During the sleep state, a dominant vagal tone and stronger EEG δ power emerge, which leads to a stronger coupling of HF-δ. All error bars indicate the mean ± SEM. Figure components incorporate illustrations from Servier Medical Art (CC BY 4.0).
Fig. 6
Fig. 6. Variational phase-amplitude coupling framework reflects dynamical BHI in OSA patients.
A The LF-δ MIs of six channels across five sleep stages were examined in OSA subjects (n = 61). (Two-way ART-ANOVA, interaction: P = 0.9466, stage: ***P < 0.0001, channel: P = 0.7754) B The HF-δ MIs of six channels across five sleep stages were examined in OSA subjects (n = 61). (Two-way ART-ANOVA, interaction: P = 0.9894, stage: ***P < 0.0001, channel: P = 0.4586) C One-way ART-ANOVA on LF-δ MIs implemented in each channel subgroup with Tukey’s post-hoc multiple comparisons tests. D One-way ART-ANOVA on HF-δ MIs implemented in each channel subgroup with Tukey’s post-hoc multiple comparisons tests. E Topoplots of the average MI of the two frequency pairs across sleep stages. F The HF-δ MIs of three obstructive sleep event subtypes across four sleep stages were examined in OSA subjects. (Two-way ART-ANOVA, interaction: P = 0.2658, stage: ***P < 0.0001, subtype: *P = 0.0307) G, H Comparisons of HF-δ MIs at four sleep stages across three obstructive sleep event subtypes in OSA subjects. One-way ART-ANOVA on HF-δ MIs was implemented in each Subtype/Stage subgroup with Scheffe’s post-hoc comparisons. I The LF-δ MIs of three obstructive sleep event subtypes across four sleep stages were examined. (Two-way ART-ANOVA, interaction: P = 0.6736, stage: P = 0.8887, subtype: **P = 0.0015) J, K Comparisons of LF-δ MIs of four sleep stages across three obstructive sleep event subtypes in OSA subjects. One-way ART-ANOVA on LF-δ MIs was implemented in each Subtype/Stage subgroup with Scheffe’s post-hoc comparisons. OA/N1 (n = 30), OA/N2 (n = 50), OA/N3 (n = 10), OA/REM (n = 35), OH/N1 (n = 49), OH/N2 (n = 50), OH/N3 (n = 27), OH/REM (n = 46), MH/N1 (n = 42), MH/N2 (n = 35), MH/N3 (n = 20), MH/REM (n = 33). All error bars indicate the mean ± SEM.
Fig. 7
Fig. 7. Variational phase-amplitude coupling framework reflects differences in BHI of OSA patients from healthy individuals.
A The HF-δ MIs between two groups across five sleep stages were examined (Healthy: n = 72; OSA: n = 61). (Two-way ART-ANOVA, interaction: ***P < 0.0001, stage: ***P < 0.0001, group: P = 0.5203; Scheffe’s post-hoc test, Healthy/N3 vs. OSA/N3, **P = 0.0027) B The LF-δ MIs between two groups across five sleep stages were examined (Healthy: n = 72; OSA: n = 61). (Two-way ART-ANOVA, interaction: ***P < 0.0001, stage: ***P < 0.0001, group: ***P < 0.0001; Scheffe’s post-hoc test, Healthy/AW vs. OSA/AW, ***P < 0.0001, Healthy/N1 vs. OSA/N1, ***P < 0.0001, Healthy/REM vs. OSA/REM, ***P < 0.0001).

Similar articles

References

    1. Engelen, T., Solcà, M. & Tallon-Baudry, C. Interoceptive rhythms in the brain. Nat. Neurosci.26, 1670–1684 (2023). - PubMed
    1. Critchley, H. D. & Harrison, N. A. Visceral influences on brain and behavior. Neuron77, 624–638 (2013). - PubMed
    1. Jin, H., Li, M., Jeong, E., Castro-Martinez, F. & Zuker, C. S. A body–brain circuit that regulates body inflammatory responses. Nature630, 695–703 (2024). - PMC - PubMed
    1. Candia-Rivera, D., Catrambone, V., Thayer, J. F., Gentili, C. & Valenza, G. Cardiac sympathetic-vagal activity initiates a functional brain–body response to emotional arousal. Proc. Natl. Acad. Sci. USA119, e2119599119 (2022). - PMC - PubMed
    1. Mather, M. & Thayer, J. F. How heart rate variability affects emotion regulation brain networks. Curr. Opin. Behav. Sci.19, 98–104 (2018). - PMC - PubMed

LinkOut - more resources