. 2025 Aug 16;8(1):1237.
doi: 10.1038/s42003-025-08632-5.

Human neural organoid microphysiological systems show the building blocks necessary for basic learning and memory

Affiliations

Human neural organoid microphysiological systems show the building blocks necessary for basic learning and memory

Dowlette-Mary Alam El Din et al. Commun Biol. .

Abstract

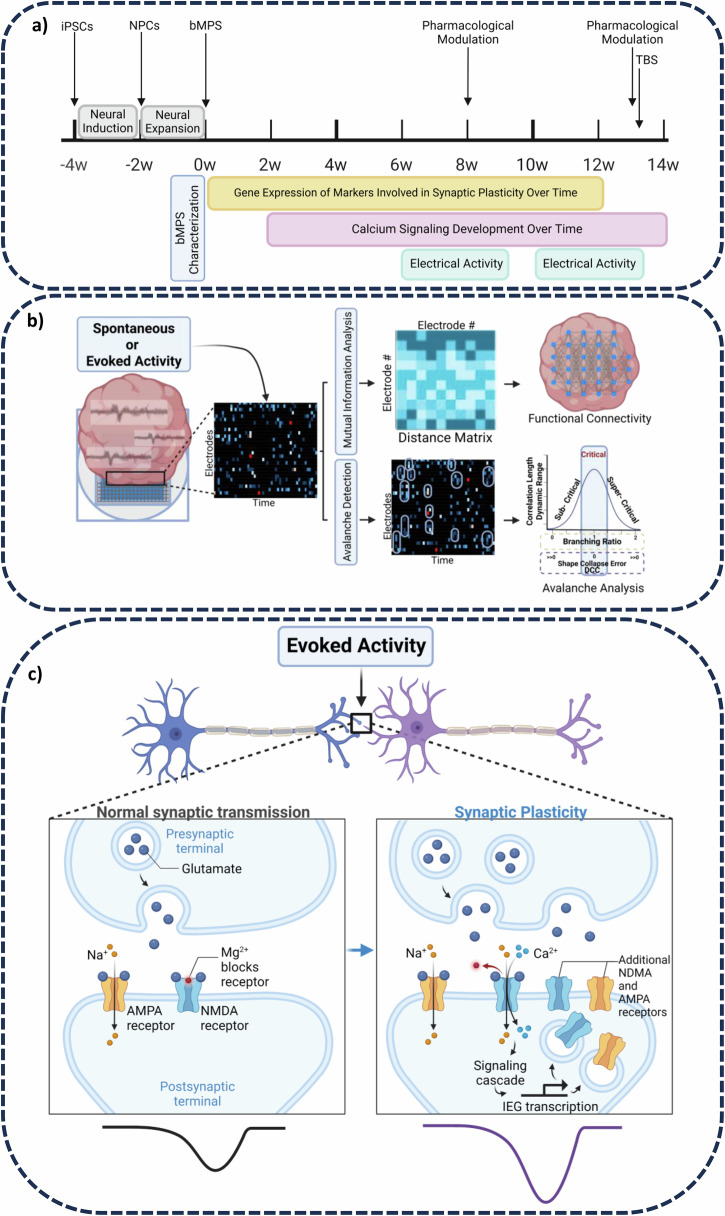
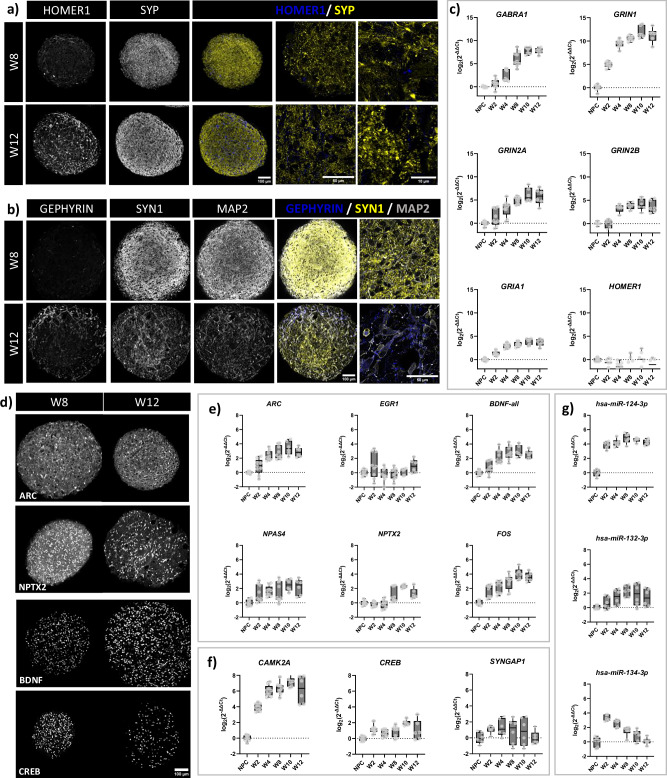
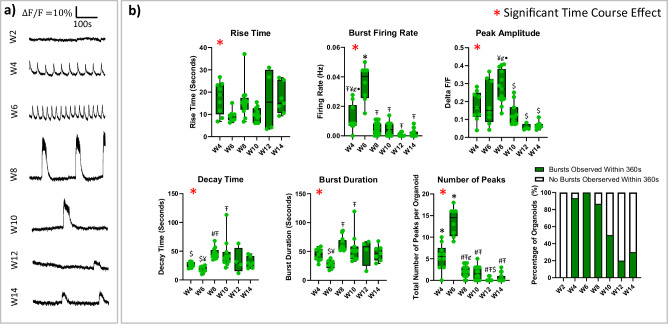
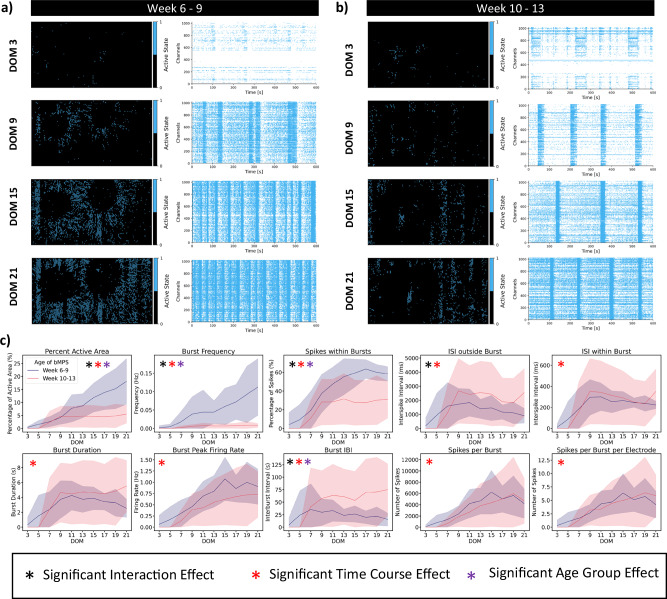
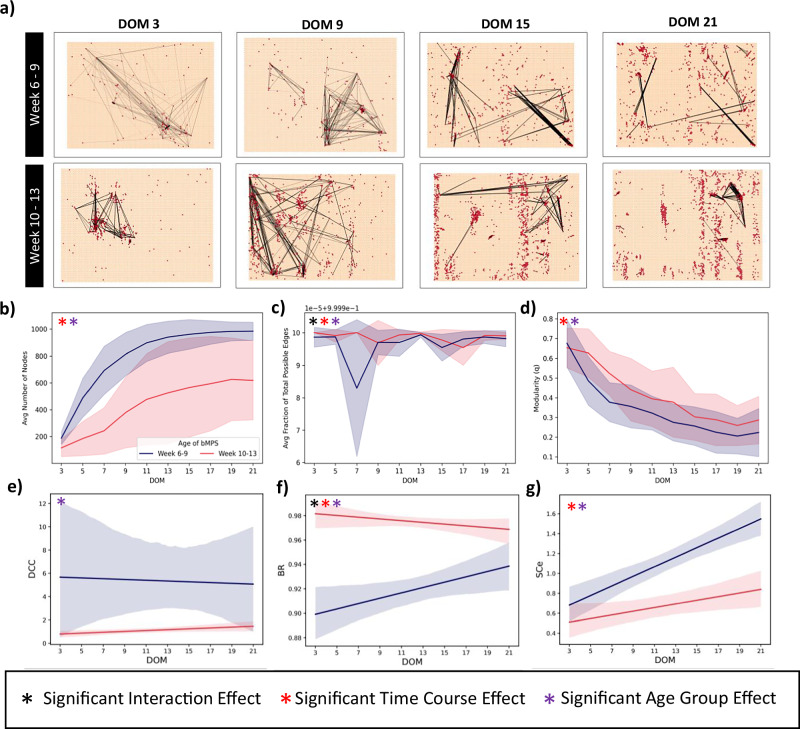
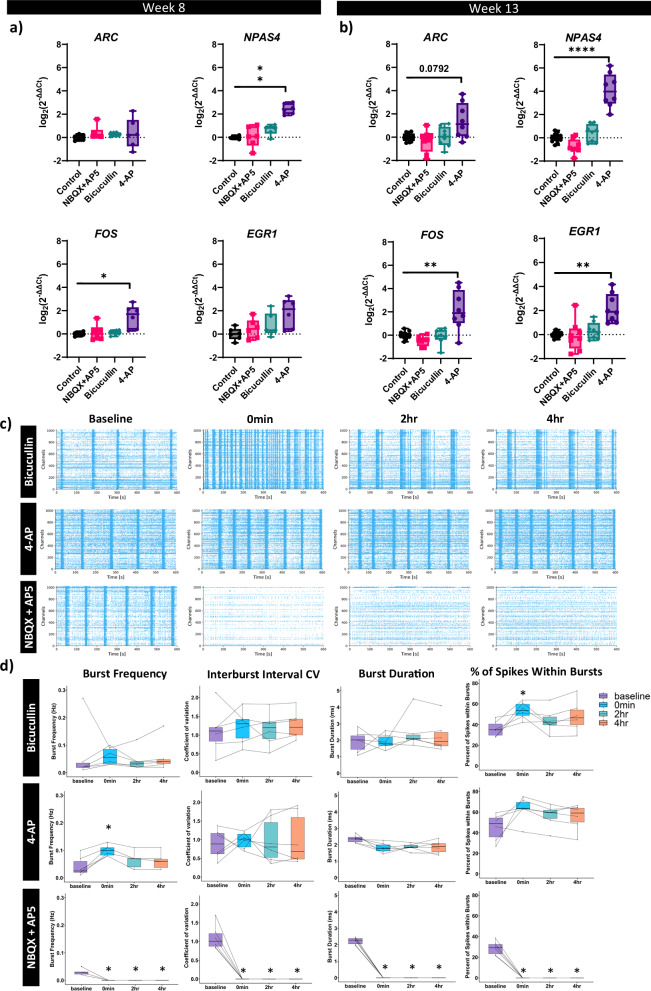
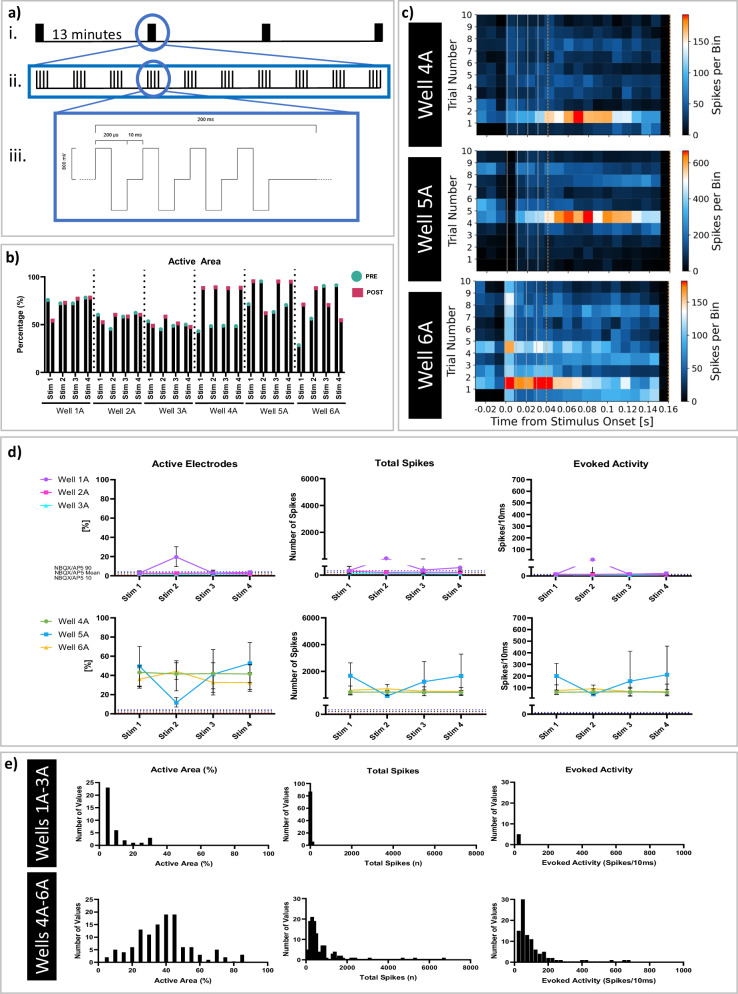
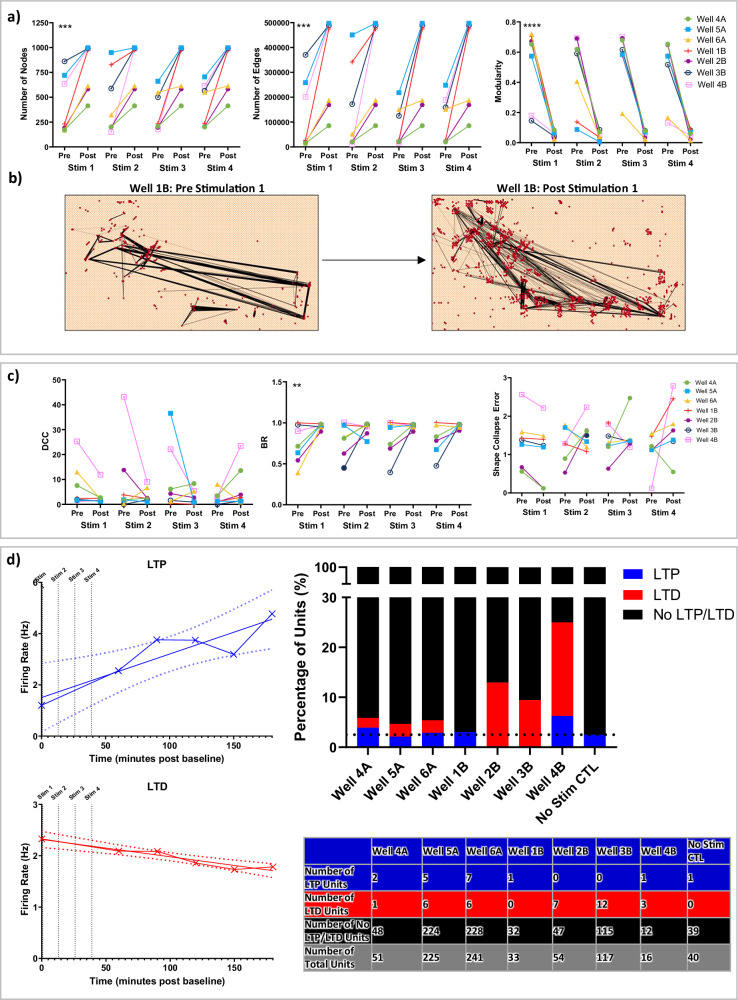
Brain Microphysiological Systems, including neural organoids derived from human induced pluripotent stem cells, offer a unique lens to study the intricate workings of the human brain. This paper investigates the foundational elements of learning and memory in neural organoids by quantifying immediate early gene expression in response to chemical modulation, input-specific short- and long-term synaptic plasticity, neuronal network dynamics, connectivity, and criticality to demonstrate the utility of these organoids in basic science research. Neural organoids showed synapse formation, glutamatergic and GABAergic receptor expression, immediate early gene expression basally and evoked, functional connectivity, criticality, and synaptic plasticity in response to theta-burst stimulation. In addition, pharmacological interventions on GABAergic and glutamatergic receptors and input-specific theta-burst stimulation further shed light on the capacity of neural organoids to mirror synaptic modulation, specifically short- and long-term potentiation and depression, demonstrating their potential as tools for studying neurophysiological and neurological processes and informing therapeutic strategies for diseases.


Conflict of interest statement

Competing interests: T.H. is named inventor on a patent by Johns Hopkins University on the production of organoids, which is licensed to Axo-Sim, New Orleans, LA, USA. T.H. and L.S. are consultants for AxoSim, New Orleans, and T.H. is also a consultant for AstraZeneca and American Type Culture Collection (ATCC) on advanced cell culture methods. B.J.K. is a named inventor on patents by CCLabs Pty Ltd trading as Cortical Labs on the use of biological neural systems for intelligent purposes. B.J.K., F.H, and A.L are employees of Cortical Labs. B.J.K. and A.L. are shareholders of Cortical Labs. J.L is a data science consultant for Vindhya Data Science specializing in bioinformatics analysis. The rest of the authors declare no conflict of interest.

Figures

Fig. 1
Fig. 1. Schematic overview of the experimental approach.
a Experimental timeline. Created in BioRender. Alam El Din, D. (2025) https://BioRender.com/v4k2lpzb Overview of avalanche and network connectivity analysis for time series electrophysiology data from organoids plated on HD-MEAs. Created in BioRender. Alam El Din, D. (2025) https://BioRender.com/trj7ehfc Schematic representation of synaptic transmission modulation by pharmacological and electrical stimuli to induce synaptic plasticity. Adapted from Kim, S. (2025). Long-Term Potentiation. https://app.biorender.com/biorender-templates/details/t-61006a6924e0d000a40de3a1-long-term-potentiation. Created in BioRender. Alam El Din, D. (2025) https://BioRender.com/eqpwhdw.
Fig. 2
Fig. 2. Expression of glutamatergic and GABAergic receptor and synaptic plasticity-related genes in neural organoids over course of differentiation.
a Representative immunocytochemistry images of organoids showing postsynaptic marker (HOMER1) and presynaptic marker (SYP) in 8- and 12-week cultures. In composite images, HOMER1 is shown in blue, and SYP is shown in yellow. Scale bars are 100 µm, 50 µm, and 10 µm, respectively. b Presence of inhibitory post-synaptic marker (Gephyrin), pre-synaptic marker (SYN1) and dendrites (MAP2) in 8- and 12-week organoids. In composite images, Gephyrin is shown in blue, SYN1 in yellow, and MAP2 in grey. Scale bars are 100 µm and 50 µm, respectively. For a, and b, all images were taken at 20x, 100x, and 100x + 4x zoom and processed with ImageJ for visualization. c Gene expression of Gamma-Aminobutyric Acid Type A Receptor Subunit Alpha1 (GABRA1), Glutamate Ionotropic Receptor NMDA Type Subunit 1 (GRIN1), Glutamate [NMDA] Receptor Subunit Epsilon-1 (GRIN2A), and Glutamate [NMDA] Receptor Subunit Epsilon-2 (GRIN2B), Glutamate Ionotropic Receptor AMPA Type Subunit 1 (GRIA1), homer scaffold protein 1 (HOMER1) in organoids over the course of differentiation. d Representative immunocytochemistry images of weeks 8 and 12 organoids stained for Neuronal Pentraxin 2 (NPTX2), Activity-Regulated Cytoskeleton-associated protein (ARC), cAMP response element-binding protein (CREB), and Brain-Derived Neurotrophic Factor (BDNF). Scale bar is 100 µm. e Gene expression over the course of differentiation of immediate early genes (IEGs) ARC, BDNF, Neuronal PAS Domain Protein 4 (NPAS4), NPTX2, Fos proto-oncogene AP-1 transcription factor subunit (FOS), and Early Growth Response 1 (EGR1). f Gene expression of synaptic slasticity- related genes: CREB, calcium/calmodulin-dependent protein kinase II A (CAMK2A), Synaptic Ras GTPase-activating protein 1 (SYNGAP1). g Gene expression of synaptic plasticity -related miRNAs. For all gene expression plots, data is shown as a box and whisker plot (with the box extending from the 25th to 75th percentiles) and represented as log2(Fold Change) normalized to NPCs from 2-3 independent experiments with 3 technical replicates each. In all qPCR experiments, ACTB was used as a reference gene.
Fig. 3
Fig. 3. Neural organoid calcium oscillatory dynamics across different time points to show maturation of spontaneous network bursting.
a Representative changes in fluorescence over resting fluorescence (∆F/F) graphs across 360 seconds for each time point from week 2 (W2) to week 14 (W14) of differentiation. b Average rise time, peak amplitude, firing rate, decay time, burst duration, number of peaks, and percentage of active organoids shown across different time points. At least 8 individual organoids across at least 3 independent experiments were imaged and quantified for each time point. Data is shown as box and whisker plots (with the box extending from the 25th to 75th percentiles). Statistics were performed using one-way ANOVA and a Tukey post-hoc test. Changes over time were significant for rise time (p < 0.05), burst firing rate (p < 0.0001), peak amplitude (p < 0.0001), decay time (p < 0.01), burst duration (p < 0.001), and total number of peaks per organoid (p < 0.0001). Pairwise comparisons are shown on the figure: # = Significant difference from week 4, Ŧ = Significant difference from week 6, $ = Significant difference from week 8, ¥ = Significant difference from week 10, ȼ = Significant difference from week 12, • = Significant difference from week 14, * = Significant difference from all weeks. For exact p values see Supplementary Tables 4–9. See also Supplementary Fig. 7 for single neuron calcium imaging analysis.
Fig. 4
Fig. 4. Changes in spontaneous electrical activity in neural organoids throughout development.
Representative raster plots and active area plots from HD-MEA recordings showing spontaneous electrical activity over time during a weeks 6-to-9 and b weeks 10-to-13 of differentiation. DOM: Days on MEAs. c Network dynamic metrics from both organoid age groups over time (blue line represents 6-to-9 week organoids, red line – 10-to-13 week organoids. The line shown represents mean and the shaded region represents the standard deviation plotted from 2 independent experiments with 5 to 6 HD-MEA wells per group per experiment with 2–5 organoids per well (n = 11–12 wells per age group). Statistics were performed using a mixed-effects model with matching and a Tukey post-hoc test. p < 0.05 was considered significant. For exact p values from pairwise comparisons, see the Supplementary Data 3 file. ISI: Interspike Interval. IBI: Interburst Interval.
Fig. 5
Fig. 5. Neural organoids show highly interconnected neuronal networks and criticality throughout development.
a Representative plots of functional connectivity at day on MEA (DOM) 3, 9, 15, and 21 for the week 6-to-9 and week 10-to-13 old organoids. For clarity of visualization, only the 200 connections (edges) with the highest mutual information are shown. Each red dot represents an electrode, and the lines indicate the connections between electrodes. The thickness of the line indicates the weight of connectivity. b Average number of nodes; c Average fraction of total possible edges; d Average modularity over time in week 6-to-9 and week 10-to-13 organoids. e Deviation from Criticality Coefficient (DCC). f Branching Ratio (BR) g Shape collapse error (SCe) over time in 6-to-9 week and 10-to-13 week old organoids. In bd the line shown represents the mean and the shaded region represents the standard deviation plotted from 2 independent experiments with 5 to 6 HD-MEA wells per group per experiment with 2–5 organoids per well (n = 11–12 wells per age group). Panels e–g show regression lines (blue line- 6–9 week old organoids, red line - 10-13 week old organoids) with a 95% confidence interval. Data plotted is from 2 independent experiments with 5-6 HD-MEA wells per group per experiment (n = 11–12 wells per age group). Statistics were performed using a two-way ANOVA and a Tukey post-hoc test. p < 0.05 was considered significant. For exact p values from pairwise comparisons, see the Supplementary Data 3 file.
Fig. 6
Fig. 6. Pharmacological characterization of synaptic transmission changes of neuronal spiking and bursting activity and Immediate Early Gene expression.
Expression of ARC, NPAS4, FOS, and EGR1 after 2 hours of exposure to 20 µM AP5 + 20 µM NBQX (pink box), 10 µM bicuculline (green box) and 100 µM 4-AP (purple box) in a 8-week and b 13-week-old organoids, represented as box and whisker plots (25th to 75th percentiles) and as log2(Fold Change) normalized to negative control (organoids with no chemical treatment = 2 h control). ACTB was used as a reference gene. The data represents 3 independent experiments with 2 technical replicates each for 8 weeks and 4-5 independent experiments with 2 technical replicates each for the 13-week time point. Statistics were calculated based on the replicate average from each independent experiment, with one-way ANOVA and post-hoc Dunnett’s tests *p < 0.05, ***p < 0.001, ****p < 0.0001 c Representative raster plots from MEA recordings in 13-week-old organoids (from 6 wells per condition) before and after treatment with bicuculline, 4-AP, and NBQX + AP5. d Burst frequency, Interburst interval coefficient of variation, burst duration, and percentage of spikes within bursts plotted as box and whisker plot (with the box extending from the 25th to 75th percentiles) for bicuculline, 4-AP, and NBXQ + AP5 treated wells prior to (baseline), 0 mins, 2 hours, and 4 hours after exposure. The data represents 3 independent experiments with 2 HD-MEA wells per experiment per chemical (n = 6). Statistical significance was calculated with repeated measures ANOVA with post-hoc Dunnett tests. p < 0.05 was considered significant. Pairwise comparisons can be seen in the Supplementary Tables 10-21 and significant groups are shown in the figure. ARC - Activity-Regulated Cytoskeleton-Associated Protein; NPAS4 – Neuronal PAS Domain Protein 4; FOS - Fos proto-oncogene AP-1 transcription factor subunit; EGR1 - Early Growth Response Protein 1; AP5 - 2-Amino-5-phosphonopentanoic acid (an NMDA receptor antagonist); NBQX – 2,3-dihydroxy-6-nitro-7-sulfamoyl-benzo[f]quinoxaline (an AMPA receptor antagonist).
Fig. 7
Fig. 7. Theta-burst stimulation modulated short-term plasticity for Experiment A.
a Graphical summary of TBS protocol. i-The TBS was performed four times spaced by 13 minutes. ii-Within each TBS there are 10 trials with four spikes per trial. iii-The schematic of each trial. b Percent active area before and after stimulation across all 6 wells. Wells 4A–6A show consistent increase or decrease in active area in response to stimulation while wells 1A–3A show little change. c Representative heat map evoked activity response for wells 4A–6A. Bin size is equal to 10 ms. The stimulation pulses are the light grey vertical lines, and the dashed orange lines indicate the start/stop time of the analysis window for calculating evoked activity. d percentage of active electrodes, total spikes, and evoked activity for wells 1A-3A and then 4A-6A. Purple circle represents well 1A, pink square – well 2 A, turquoise triangle – well 3A, green circle – well 4A, blue square – well 5A, and yellow triangle – well 6A. The data represents the mean with 10th to 90th percentile for each well. The 90th percentile response of a well treated with NBQX/AP5 before and during stimulation is shown with a blue dashed line overlayed on all graphs. The mean response of a well-treated with NBQX/AP5 before and during stimulation is shown in a black dashed line overlayed on all graphs. The 10th percentile response of a well treated with NBQX/AP5 before and during stimulation is shown in a red dashed line overlayed on all graphs. Responses above this NBQX/AP5 region indicate responses generated by glutamatergic receptors. e Histograms of total evoked activity per bin (bin size of 10 ms), total spikes, and total active area. The top three graphs show data aggregated across all electrodes for all 4 TBS for wells 1A–3A, and the bottom three graphs show data aggregated across all electrodes for all 4 TBS for wells 4A-6A. Wells 1A-3A show little to no response while wells 4A-6A indicate evoked responses on the millisecond timescale.
Fig. 8
Fig. 8. Theta-burst stimulation drives short-term changes in connectivity and criticality and long-term potentiation and depression of neuronal units.
a Connectivity metrics for all wells that demonstrated STP. b Representative connectivity graph before and immediately following TBS #1 for well 1B. c Criticality metrics for all wells that demonstrated STP. The data represents the mean of seven biological replicates from two independent experiments. A Wilcoxon matched-pairs signed rank test was performed to determine statistical significance for a and c, **p < 0.01, ***p < 0.001, ****p < 0.0001. Exact p-values are listed in Supplementary Tables 22–27. For a and c green circle represents well 4A, blue square – well 5 A, yellow triangle -well 6A, red line – well 1B, purple circle – 2B, open blue circle – 3B, open pink square – 4B. d) Quantification of input-specific long-term potentiation (LTP) and depression (LTD) by measuring firing rate over time in neuronal units. Two example units demonstrating either LTP (blue line with 95% confidence intervals depicted with dashed lines) or LTD (red line, with 95% confidence intervals depicted with dashed lines) are shown on the left. The proportion of neuronal units that demonstrated LTP (red) or LTD (blue) across wells is demonstrated and quantified on the right.

Update of

Similar articles

Cited by

  • Protosequences in brain organoids model intrinsic brain states Authors.
    van der Molen T, Spaeth A, Chini M, Hernandez S, Kaurala GA, Schweiger HE, Duncan C, McKenna S, Geng J, Lim M, Bartram J, Dendukuri A, Zhang Z, Gonzalez-Ferrer J, Bhaskaran-Nair K, Blauvelt LJ, Harder CRK, Petzold LR, Alam El Din DM, Laird J, Schenke M, Smirnova L, Colquitt BM, Mostajo-Radji MA, Hansma PK, Teodorescu M, Hierlemann A, Hengen KB, Hanganu-Opatz IL, Kosik KS, Sharf T. van der Molen T, et al. bioRxiv [Preprint]. 2025 Jan 8:2023.12.29.573646. doi: 10.1101/2023.12.29.573646. bioRxiv. 2025. PMID: 38234832 Free PMC article. Preprint.

References

    1. Smirnova, L. & Hartung, T. The promise and potential of brain organoids. Adv. Healthc. Mater. e2302745 10.1002/adhm.202302745 (2024). - PubMed
    1. Acharya, P., Choi, N. Y., Shrestha, S., Jeong, S. & Lee, M.-Y. Brain organoids: A revolutionary tool for modeling neurological disorders and development of therapeutics. Biotechnol. Bioeng.121, 489–506 (2024). - PMC - PubMed
    1. Birey, F. et al. Assembly of functionally integrated human forebrain spheroids. Nature545, 54–59 (2017). - PMC - PubMed
    1. Qian, X. et al. Brain region-specific organoids using mini-bioreactors for modeling ZIKV exposure. Cell165, 1238–1254 (2016). - PMC - PubMed
    1. Quadrato, G. et al. Cell diversity and network dynamics in photosensitive human brain organoids. Nature545, 48–53 (2017). - PMC - PubMed

LinkOut - more resources