. 2025 Aug 16;15(1):29993.
doi: 10.1038/s41598-025-14805-3.

Directional hand movement can be classified from insular cortex SEEG signals using recurrent neural networks and high-gamma band features

Affiliations

Directional hand movement can be classified from insular cortex SEEG signals using recurrent neural networks and high-gamma band features

Xiecheng Shao et al. Sci Rep. .

Abstract

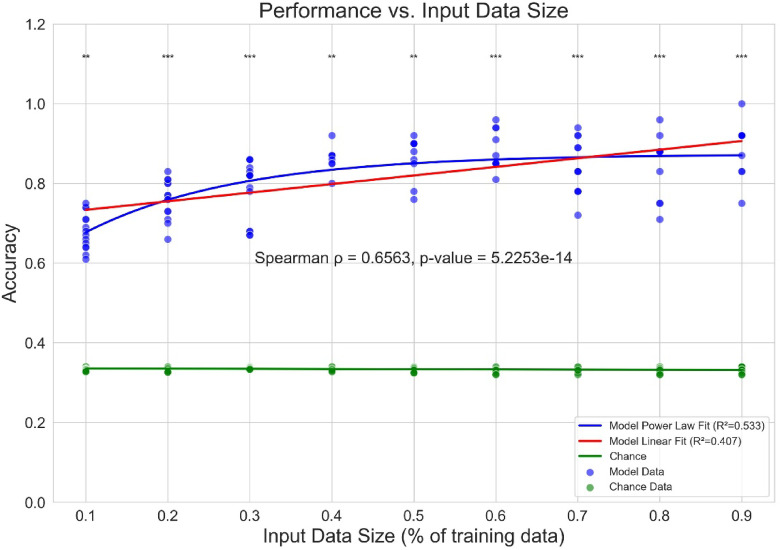
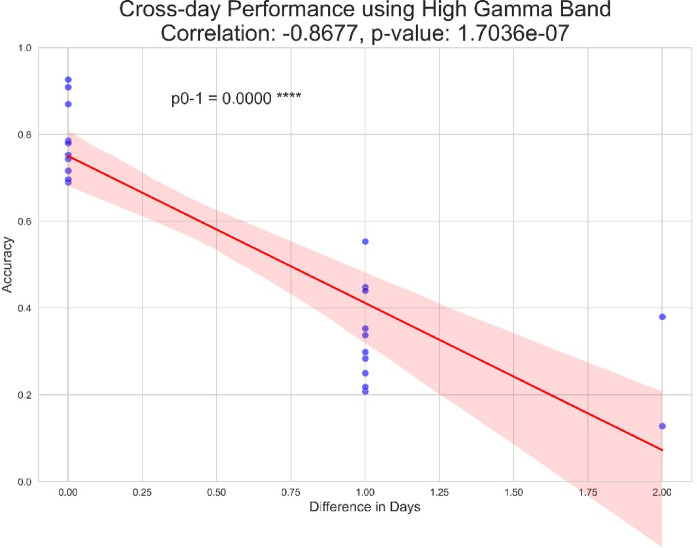
Motor BCIs, with the help of Artificial Intelligence (AI) and machine learning, have shown promise in decoding neural signals for restoring motor function. Structures beyond motor cortex have provided additional sources for movement signals. New evidence points to the role of the insula in motor control, specifically directional hand-movements. In this study, we applied AI and machine learning techniques to decode directional hand-movements from high-gamma band (70-200 Hz) activity in the insular cortex. Seven participants with medication-resistant epilepsy underwent stereo electroencephalographic (SEEG) implantation of depth electrodes for seizure monitoring in the insula. SEEG data were sampled throughout a cued motor task involving three conditions: left-hand movement, right-hand movement, or no movement. Neural signal processing focused on high-gamma band activity. Demixed Principal Component Analysis (dPCA) was used for dimension reduction (d = 10) and feature extraction from the time-frequency analysis. For movement classification, we implemented a bidirectional Long Short-Term Memory (LSTM) architecture with a single layer, utilizing the capacity to process temporal sequences in forward and back directions for optimal decoding of movement direction. Our findings revealed robust directional-specific high-gamma modulation within the insular cortex during motor execution. Temporal decomposition through dPCA demonstrated distinct spatiotemporal patterns of high-gamma activity across movement conditions. Subsequently, LSTM networks successfully decoded these condition-specific neural signatures, achieving a classification accuracy of 72.6% ± 13.0% (mean ± SD), which significantly exceeded chance-level performance of 33.3% (p < 0.0001, n = 16 sessions). Furthermore, we identified a strong negative correlation between temporal distance of training-testing sessions and decoding performance (r = -0.868, p < 0.0001), indicating temporal difference of the neural representations. Our study highlights the potential role of deep brain structures, such as the insula, in conditional movement discrimination. We demonstrate that LSTM networks and high-gamma band analysis can advance the understanding of neural mechanisms underlying movement. These insights may pave the way for improvements in SEEG-based BCI.

Keywords: AI; BCI; Insula; Insular cortex; Neural networks; SEEG.


Conflict of interest statement

Declarations. Competing interests: The authors declare no competing interests.

Figures

Fig. 1
Fig. 1
Accuracy comparison across different frequency bands and processing methods. Box plots show classification accuracies for dPCA-processed data (green), non-dPCA processed data (yellow), and chance level (purple) across four frequency bands: alpha, beta, gamma, and high-gamma. Each plot represents a different frequency band, with accuracy on the y-axis ranging from 0 to 1.0. The dPCA method consistently demonstrates higher median accuracy and smaller interquartile ranges compared to non-dPCA and chance, with the most pronounced improvement visible in the high-gamma band. Whiskers extend to the minimum and maximum values, excluding outliers. Significance levels: p₁ (dPCA vs. non-transformed), p₂ (dPCA vs. chance), p₃ (non-transformed vs. chance); all p < 0.0001.
Fig. 2
Fig. 2
Comparison of movement decoding accuracy between the insula and other brain regions. Box plots illustrate classification accuracy distributions from LSTM models trained on intracranial EEG recordings from different brain regions. (A) Amygdala vs. Insula: The insula showed significantly higher decoding accuracy (mean = 0.742) compared to the amygdala (mean = 0.538, p < 0.001). (B) Cingulate vs. Insula: The insula demonstrated superior decoding performance (mean = 0.721) compared to the cingulate cortex (mean = 0.593, p < 0.001), with some outliers visible in the insula distribution. (C) Frontal vs. Insula: The frontal region exhibited higher mean accuracy (0.763) than the insula (0.687) (D) Hippocampus vs. Insula: The insula achieved significantly higher decoding accuracy (mean = 0.742) than the hippocampus (mean = 0.616, p < 0.001). Box plots display the median (horizontal line), interquartile range (box), and minimum/maximum values within 1.5 times the interquartile range (whiskers). Statistical significance was assessed using Wilcoxon rank-sum test (***p < 0.001).
Fig. 3
Fig. 3
Normalized power spectral density (PSD) in the high-frequency band (70–200 Hz) is recorded from the insula region during three different movement conditions: left movement (red), right movement (green), and no movement (blue). Solid lines represent median values across all trials, all contacts in insula region, and the shaded areas denote the interquartile range (IQR) for each condition. The data are normalized to fixation phase for each trial each frequency bin prior to plot. The analysis reveals no differences in neural representations between movement conditions within the insula.
Fig. 4
Fig. 4
Demixed Principal Component Analysis (dPCA) of neural population data. Left: Average trajectories of different classes with(A)/without(C) dPCA transformation, shown with their respective confidence intervals (shaded regions). Each line represents the mean trajectory of a distinct class across time. Right: Heatmap showing the first dPCA dimension(B), or first feature(D) for individual trials (rows) across time (columns). Color intensity represents the magnitude of the transformed neural activity in the first demixed dimension, with warmer colors (yellow) indicating higher values and cooler colors (dark blue) indicating lower values. The consistency of patterns across trials within similar time periods after dPCA transformation suggests structured temporal dynamics in the neural population.
Fig. 5
Fig. 5
Model performance between a linear model (LDA), SVM (RBF kernel), and LSTM using dPCA transformed data. LSTM shows best performance (mean = 0.726) significantly higher (Wilcoxon one-sided sign rank test, p < 0.005) than LDA (mean = 0.554) and SVM (mean = 0.561). There is no significant difference between performance of LDA and SVM (Wilcoxon two-sided sign rank test, p > 0.05).
Fig. 6
Fig. 6
Performance vs. Input Data Size for Model and Chance predictions. Scatter plot shows accuracy (y-axis, 0 to 1) against training data size proportion of total training data (x-axis, 0.1 to 0.9). Blue dots represent model performance, with a red trend line (correlation: 0.407, p < 0.001 using a linear function fit and a blue trend line (correlation: 0.533, p < 0.001) showing positive correlation. Green dots represent chance performance, with a flat green trend line (correlation: -0.0379, p-value: 7.718e-01) indicating no significant correlation. The model consistently outperforms chance across all input data sizes, with accuracy improving as data size increases.
Fig. 7
Fig. 7
Cross-day Performance using High Gamma Band. Scatter plot illustrates the relationship between accuracy (y-axis, 0 to 1.0) and difference in days between training and testing (x-axis, 0 to 2.0). Blue dots represent individual data points. The red line shows the negative linear correlation (correlation: -0.868, p-value: 1.703e-07) with a 95% confidence interval (pink shaded area). A significant drop in performance is observed between same-day (0.00) and 1 day difference (1.00) testing, as indicated by p0-1 < 0.0001. The plot demonstrates a strong inverse relationship between temporal distance and model accuracy in the high gamma band.
Fig. 8
Fig. 8
Temporal sequence of the left/right discrimination task paradigm. The trial begins with an inter-trial interval (ITI) of 1s, followed by a fixation period (1s) where participants focus on a central dot. A target cue (Cue 1) is then presented for 1s, indicating the required movement direction (left or right). After a holding period (Cue 2, 0.5s), participants are prompted by a response cue to execute the instructed movement. Each screen displays a black background with white stimuli to maintain consistent luminance throughout the task. The temporal progression flows from bottom to top, with precise timing intervals indicated for each phase of the trial.

Similar articles

References

    1. Wolpaw, J. R. & McFarland, D. J. Control of a two-dimensional movement signal by a noninvasive brain-computer interface in humans. Proceedings of the National Academy of Sciences. 101 (51) 17849–17854. (2004). 10.1073/pnas.0403504101 - PMC - PubMed
    1. Birbaumer, N. & Cohen, L. G. Brain–computer interfaces: communication and restoration of movement in paralysis. J. Physiol.579 (Pt 3), 621–636. 10.1113/jphysiol.2006.125633 (2007). - PMC - PubMed
    1. Yamamoto, T. Recent advancement of technologies and the transition to new concepts in epilepsy surgery. Neurol. Med. Chir. (Tokyo). 60 (12), 581–593. 10.2176/nmc.ra.2020-0197 (2020). - PMC - PubMed
    1. Youngerman, B. E., Khan, F. A. & McKhann, G. M. Stereoelectroencephalography in epilepsy, cognitive neurophysiology, and psychiatric disease: safety, efficacy, and place in therapy. Neuropsychiatr Dis. Treat.15, 1701–1716. 10.2147/NDT.S177804 (2019). - PMC - PubMed
    1. Herff, C., Krusienski, D. J. & Kubben, P. The potential of Stereotactic-EEG for Brain-Computer interfaces: current progress and future directions. Front. Neurosci.1410.3389/fnins.2020.00123 (2020). - PMC - PubMed

LinkOut - more resources