. 2025 Aug 16;16(1):7634.
doi: 10.1038/s41467-025-62887-4.

Pangenome analysis of transposable element insertion polymorphisms reveals features underlying cold tolerance in rice

Affiliations

Pangenome analysis of transposable element insertion polymorphisms reveals features underlying cold tolerance in rice

Yongqing Qian et al. Nat Commun. .

Abstract

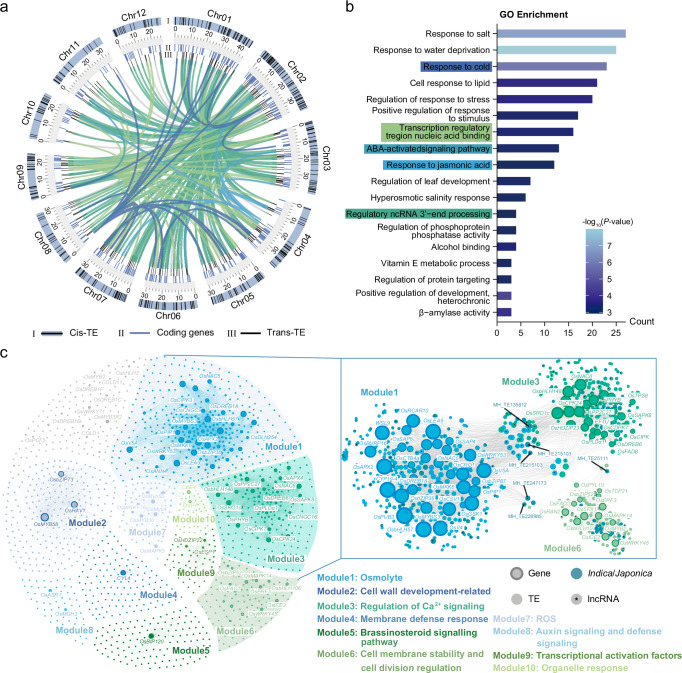
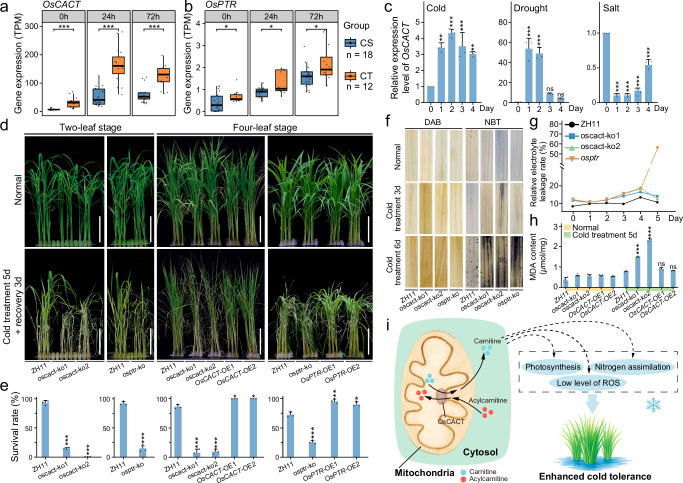
Transposable elements (TEs) introduce genetic and epigenetic variability, contributing to gene expression patterns that drive adaptive evolution in plants. Here, we investigate TE architecture and its effect on cold tolerance in rice. By analyzing a pangenome graph and the resequencing data of 165 rice accessions, we identify 30,316 transposable element insertion polymorphism (TIP) sites, highlighting significant diversity among polymorphic TEs (pTEs). We observe that pTEs exhibit increased H3K27me3 enrichment, suggesting a potential role in epigenetic differentiation under cold stress and in the transcriptional regulation of the cold response. We identify 26,914 TEs responsive to cold stress from transcriptome data, indicating their potential significance in regulatory networks for this response. Our TIP-GWAS analysis reveal two cold tolerance genes OsCACT and OsPTR. The biological functions of these genes are confirmed using knockout and overexpression lines. Our web tool ( https://cbi.gxu.edu.cn/RICEPTEDB/ ) makes all pTEs available to researchers for further analysis. These findings provide valuable targets for breeding cold-tolerant rice varieties, indicating the potential importance of pTEs in crop enhancement.


Conflict of interest statement

Competing interests: The authors declare no competing interests.

Figures

Fig. 1
Fig. 1. Genomic features and population structure of 165 rice accessions.
a Circos plot illustrating the genomic characteristics of the TB accession. The outer to inner circles represent: chromosomes (with centromeres highlighted in dark blue), gene density, Gypsy density, Helitron density, GC content, structural variation (SV) density, and TIP density. The shades transitioning from light to dark indicate increasing numerical values. The numbers labeling the outer circle indicate the length (Mb) of each chromosome. b TE content across the 10 rice assemblies. The phylogenetic tree was constructed based on single-copy genes from the assemblies. c Variation in gene families within the pan-genome and core genome as the number of rice genomes increases. d The number of different TE insertions in genic regions, which include sequences 2 kb upstream and downstream of each gene body. e Principal component analysis (PCA) plot of 165 rice accessions based on TIPs. f Population structure analysis conducted for 165 accessions with varying ancestry kinship (K  =  2–7) based on TIPs. Each vertical bar represents an accession, and the x-axis displays the different subpopulations: Aus (aus), Ind I (indica I), Ind II (indica II), Ind III (indica III), Ind int (indica intermediate), Int (intermediate), Jap int (japonica intermediate), Tem jap (temperate japonica) and Tro jap (tropical japonica). The y-axis quantifies ancestry membership. Source data are provided as a Source Data file.
Fig. 2
Fig. 2. Transcriptional and epigenetic features of pTEs.
a The four-step pipeline we used to construct a rice TIP map. First, the rice genome was sequenced to obtain raw reads, including both long reads and short reads. Subsequently, de novo assembly was performed, followed by the annotation of TEs and genes. Finally, a pangenome graph was constructed, from which SVs were extracted for TE annotation. This information was then integrated with gene annotations to generate the rice TIP map. The SVs annotated as TEs are referred to as pTEs. b Bar plot illustrating the number of genes at various genic regions with pTE insertions. The numbers above the bars represent the number of genes with a single pTE insertion. The gray bars represent the gene number with pTE insertions at multiple locations. c The impact of pTE insertions on gene expression levels at different cold treatment time points. pTEs in different rice varieties are categorized into two groups: those with TE ( + TE) and those without TE (-TE). “Upstream” indicates that a single pTE is located within 2 kb of the gene and inserted in the upstream region, while “Exon” signifies that a single pTE is also located within 2 kb of the gene but inserted within the exon. Box plots show the distribution of gene expression levels: the center line represents the median, the box bounds indicate the 25 and 75th percentiles, the whiskers extend to the minimum and maximum values. For the “Upstream” category, n = 4573 genes; for the “Exon” category, n = 1385 genes. Statistical analysis of these data was performed using a two-tailed Wilcoxon test (***P < 0.001, ns: P > 0.05). d Workflow for classifying genomic sequences into pTE, consensus TE (cTE), and non-TE categories. The two genomes used for comparison are Nipponbare and MH63. e H3K27me3 enrichment and epigenetic profiles surrounding genes, cTEs and pTEs. f Proportions of different histone modifications among whole genome sequences (WGS) of different categories. g Proportions of different histone modifications among gene flanking sequences (GFS) of different categories. GFS refers to the sequences of genes and their flanking 2 kb within the genome. Source data are provided as a Source Data file.
Fig. 3
Fig. 3. Cold-responsive TEs and genes identified by transcriptome analysis.
a Circos plot showing the loci of cis-TEs, trans-TEs, and co-expression coding genes. The internal links represent the correspondence between cold-responsive co-expression genes and their associated trans-TEs. The numbers indicate the length (Mb) of each chromosome. b GO enrichment analysis of coding genes associated with trans-TEs. GO terms are ranked by the number of enriched genes, with colored terms indicating associations with cold response, corresponding to the colors in Fig. 3a. GO enrichment analysis was performed using a one-tailed (right-tailed) Hypergeometric test, with P values adjusted using the Benjamini-Hochberg method to control the false discovery rate. c Co-expression network of known cold tolerance genes and cold-responsive TEs. Different module colors represent gene sets with similar functions. The right subnetwork illustrates the co-expression relationships between genes and TEs in modules 1, 3, and 6. Genes, TEs, conserved TEs between indica and japonica, and TEs expressing long noncoding RNAs (lncRNAs) are marked with corresponding symbols. The labeled TEs represent cold-responsive TEs with high connectivity and potential functions. Source data are provided as a Source Data file.
Fig. 4
Fig. 4. GWAS analysis using the rice TIP map.
a Manhattan plot of GWAS for rice survival rates under cold stress using SVs based on the MH63 genome. The labeled quantitative trait locus (QTL) loci represent locations with high significance and continuous peaks. The genes in parentheses are previously reported cold-tolerance genes significantly associated with these loci. The two highlighted labels indicate loci strongly associated with OsCACT and OsPTR. b, c Manhattan plots of OsCACT (b) and OsPTR (c) associated loci. The dots represent the log-transformed P values of single-nucleotide polymorphism (SNP) and SV GWAS. The color of the dots reflects the linkage disequilibrium (LD) between the variant and the labeled lead SV. The bottom plots represent the gene structure at each respective locus. d, e ONT reads mapping based on MH63 (d) and T2T-NIP (e). The top plots display the gene structure diagrams. The four tracks labeled K, R, TB, and L represent haplotype A (HapA) for japonica, while the six tracks labeled KO, M, N, NJ, T, and Y represent haplotype B (HapB) for indica. The numbers at the right end of each track indicate the reads coverage, and the area between the two dashed lines represents the insertion (d) and the deletion (e). f, g Comparison of survival rates for different haplotypes of OsCACT (f) and OsPTR (g) under cold stress. The donut plots illustrate the distribution in different subpopulations and quantity of the 165 accessions across hapA, hapB, and heterozygous (Hetero) categories. The box plots show the survival rates of accessions with different haplotypes. In the box plots, the center line represents the median, the box bounds indicate the 25th and 75th percentiles, and the whiskers extend to the minimum and maximum values. n indicates the number of rice accessions in each haplotype group. Statistical analysis of these data was performed using a two-tailed Wilcoxon test. Source data are provided as a Source Data file.
Fig. 5
Fig. 5. The regulation of cold tolerance in rice by OsCACT and OsPTR.
a, b Box plots of OsCACT (a) and OsPTR (b) expression levels at different cold treatment time points. The different colors represent cold-sensitive (CS) strains, which include six indica accessions, and cold-tolerant (CT) varieties, consisting of four japonica accessions. In the box plots, the center line represents the median, the box bounds indicate the 25th and 75th percentiles, and the whiskers extend to the minimum and maximum values. For CS (n = 6) and CT (n = 4), each accession was assessed with 3 biological replicates (total n = 18 and 12, respectively). Statistical analysis was performed using a two-tailed Wilcoxon test (*P < 0.05, ***P < 0.001). c Bar plots of OsCACT relative expression levels over time under cold, drought, and salt stress. For each time point, n = 3 biological replicates. Statistical analysis was performed using a two-tailed Student’s t-test, with 0 day as the reference (**P < 0.01, ***P < 0.001, ns: P > 0.05). Error bars present mean values  ±  SD. d Representative images of the transgenic lines (OsCACT and OsPTR knockout mutants and overexpression lines) and their corresponding control of Zhonghua 11 (ZH11) after 5 days of cold treatment followed by 3 days of recovery at the two-leaf and four-leaf stages. Scale bar: 5 cm. e Bar plots of plant survival rates after 5 days of cold treatment. For each time point, n = 3 biological replicates. Statistical analysis was performed using a two-tailed Student’s t-test, with ZH11 as the reference (*P < 0.05, ***P < 0.001). Error bars present mean values  ±  SD. f DAB and NBT staining images of leaves from ZH11 and two genes knockout mutants at different cold treatment time points at the two-leaf stage. g Line plots of relative electrolyte leakage rates of two genes knockout mutants and ZH11 over during cold treatment at the two-leaf stage. h Bar plots of MDA content in ZH11, OsCACT knockout mutants, and OsCACT overexpression lines after 5 days of cold treatment at the four-leaf stage. For each time point, n = 3 biological replicates. Statistical analysis was performed using a two-tailed Student’s t-test, with ZH11 as the reference (***P < 0.001, ns: P > 0.05). Error bars present mean values  ±  SD. i Model diagram of the mechanism by which OsCACT enhances cold tolerance in rice. The expression of OsCACT in the mitochondrial inner membrane affects the carnitine content in cells, which in turn influences rice cold tolerance through three distinct pathways. oscact-ko1 OsCACT knockout mutant-1, oscact-ko2 OsCACT knockout mutant-2; OsCACT-OE-1 OsCACT overexpression line-1; OsCACT-OE-2 OsCACT overexpression line-2, osptr-ko OsPTR knockout mutant, OsPTR-OE-1 OsPTR overexpression line-1, OsPTR-OE-2 OsPTR overexpression line-2, DAB, 3, 3’-diaminobenzidine; NBT nitro blue tetrazolium, MDA malondialdehyde. Source data are provided as a Source Data file.

Similar articles

References

    1. Wang, W. et al. Genomic variation in 3010 diverse accessions of Asian cultivated rice. Nature557, 43–49 (2018). - PMC - PubMed
    1. Wing, R. A., Purugganan, M. D. & Zhang, Q. The rice genome revolution: from an ancient grain to Green Super Rice. Nat. Rev. Genet.19, 505–517 (2018). - PubMed
    1. Gross, B. L. & Zhao, Z. Archaeological and genetic insights into the origins of domesticated rice. Proc. Natl Acad. Sci.111, 6190–6197 (2014). - PMC - PubMed
    1. Lesk, C., Rowhani, P. & Ramankutty, N. Influence of extreme weather disasters on global crop production. Nature529, 84–87 (2016). - PubMed
    1. Fu, J. et al. Extreme rainfall reduces one-twelfth of China’s rice yield over the last two decades. Nat. Food4, 416–426 (2023). - PubMed

LinkOut - more resources