. 2025 Aug 16;16(1):7651.
doi: 10.1038/s41467-025-62895-4.

Alpha-synuclein interacts with regulators of ATP homeostasis in mitochondria

Affiliations

Alpha-synuclein interacts with regulators of ATP homeostasis in mitochondria

Tetiana Serdiuk et al. Nat Commun. .

Abstract

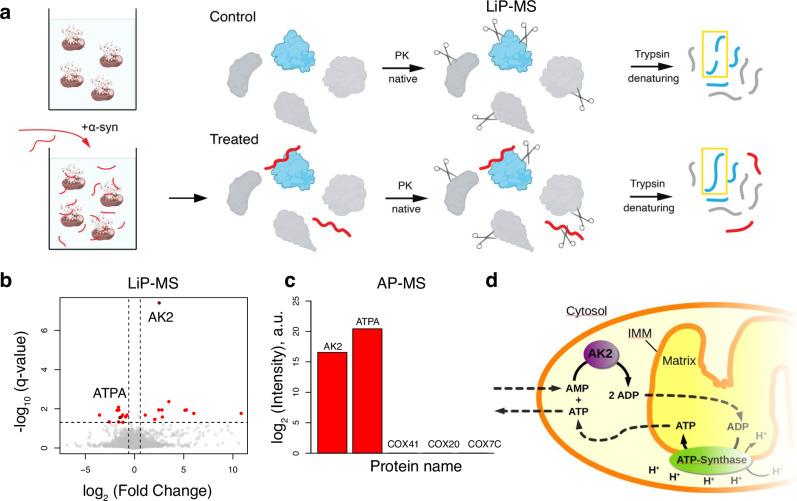
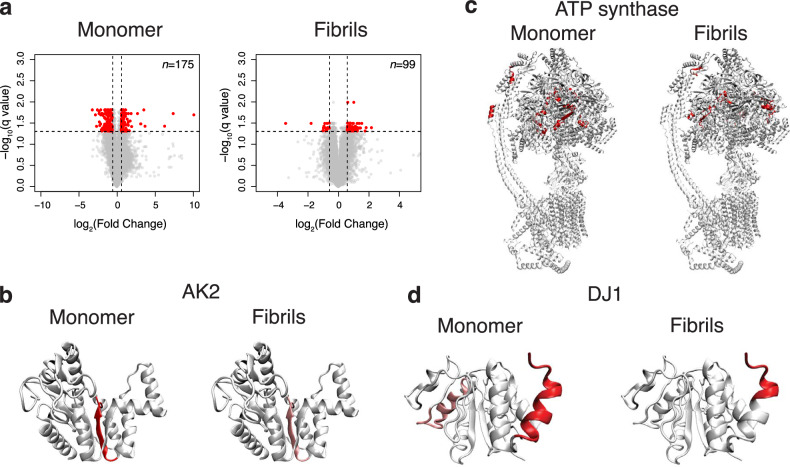
Mitochondrial dysfunction and accumulation of α-synuclein aggregates are hallmarks of the neurodegenerative Parkinson's disease and may be interconnected. To investigate the interplay between α-synuclein and brain mitochondria at near atomic structural level, we apply NMR and identify α-synuclein protein interactors using limited proteolysis-coupled mass spectrometry (LiP-MS). Several of the proteins identified are related to ATP synthesis and homeostasis and include subunits of ATP synthase and the adenylate kinase AK2. Furthermore, our data suggest that α-synuclein interacts with the Parkinson's disease-related protein DJ1. NMR analysis demonstrates that both AK2 and DJ1 bind to the C-terminus and other segments of α-synuclein. Using a functional assay for AK2, we show that monomeric α-synuclein has an activating effect, whereas C-terminally truncated α-synuclein and α-synuclein in an amyloid fibrillar state have no significant effect on AK2 activity. Our results suggest that α-synuclein modulates ATP homeostasis in a manner dependent on its conformation and its C-terminal acidic segment.


Conflict of interest statement

Competing interests: Paola Picotti is a scientific advisor for the company Biognosys AG (Zurich, Switzerland) and an inventor of a patent licensed by Biognosys AG that covers the LiP-MS method used in this manuscript. All other authors declare no competing interests.

Figures

Fig. 1
Fig. 1. Transient residue-resolved interaction of mitochondria with αSyn.
Comparison between the chemical shift perturbations and intensity changes of αSyn caused by interaction with either lysed bovine mitochondria (green) or cardiolipin nanodiscs (blue). The data is presented as a rolling average of three points. Peak positions and peak intensities are extracted from 2D [15N,1H] HMQC NMR spectra. a Intensity ratios of peaks in the presence (I) and absence (I0) of nanodiscs or lysed bovine brain mitochondria. b Chemical shift perturbations (CSPs) of peaks in the presence and absence of nanodiscs or lysed bovine brain mitochondria. a, b The interaction with lipid membrane nanodiscs appears to influence the N-terminal region of αSyn, indicating an interaction between the positively charged N-terminal segment of αSyn with the negatively charged cardiolipin, as expected, with the second half of the sequence showing no changes. The interaction with mitochondria causes relevant changes in all regions of the sequence, indicating multiple transient interactions that may include membrane interactions. Source data are provided as a Source Data file.
Fig. 2
Fig. 2. Identification of αSyn interaction partners from the mitochondrial proteome determined by LiP-MS.
LiP-MS of bovine brain mitochondrial enriched fraction treated with WT αSyn for 15 min. a Schematic illustration of the principle of LiP-MS. αSyn-treated and control (untreated) mitochondria were subjected to the LiP-MS workflow. PK was added for 5 min to native mitochondrial proteomes treated and untreated with αSyn. Mitochondrial proteins interacting with αSyn are partially shielded from PK digestion in treated conditions and accessible to PK in untreated conditions. After PK digestion is stopped, proteomes are denatured and digested by trypsin. Peptides are analyzed by LC-MS/MS. Proteins and the regions involved in interaction with αSyn are identified and quantified. Created in BioRender. Picotti (2025) https://BioRender.com/051y6yl; Created in BioRender. Picotti (2025) https://BioRender.com/wo2308i. b Volcano plot showing LiP-MS peptides reporting on interactions of αSyn with specific proteins. Red dots show statistically significant hits (fold change > 1.5, q-value < 0.05, based on a two-tailed t-test followed by Benjamini–Hochberg adjustment for multiple hypothesis testing). c AP-MS validation of AK2 interaction with αSyn monomer. Intensities are shown after subtraction of the background (isotype-specific control). d Illustration depicting the role of AK2 in the intermembrane space of the mitochondria. AK2 helps in the recycling of AMP by converting it to ADP, which is transported to the matrix to be used by the ATP-synthase. Source data are provided as a Source Data file.
Fig. 3
Fig. 3. The interaction between AK2 and αSyn is facilitated through the C-terminal region of αSyn, affecting widespread small structural changes on AK2, including the hinge region in particular.
a Intensity ratios of αSyn peaks in the presence and absence of AK2 extracted from 2D [15N,1H] HMQC NMR. A general decrease around the C-terminus indicates binding of this region to AK2. b Log2(fold change) of AK2 peptide (NGFLLDGFPR) proteolytic protection for αSyn monomer and ΔC-αSyn. c 2D [15N,1H] HMQC NMR spectrum of 150 μM 15N-labeled AK2 in the presence (blue) and absence (red) of 200 μM WT αSyn in PBS pH 7.5 at 25 °C. AK2 keeps its folded structure, however, many changes all over the spectrum can be seen. d Mapping the LiP-MS significant peptide of AK2 to its structure for interactions with WT αSyn monomer and ΔC-αSyn. The last panel shows the charge distribution of AK2. e, f Prediction of interaction between AK2 and αSyn. e Alpha-fold 2-based simulation of interactions between AK2 and WT αSyn. AK2 is shown in gray and αSyn in blue. In red is the AK2 peptide that changes in structure in the LiP-MS experiment. Portions of this peptide are at the predicted interaction interface. f Mapping the predicted interaction interface of AK2 on the sequence of αSyn. Source data are provided as a Source Data file.
Fig. 4
Fig. 4. αSyn enhances AK2 catalytic activity.
1D proton NMR-based AK2 activity assay in the presence and absence of WT αSyn, αSyn fibrils, or C-terminal truncated αSyn (ΔC-αSyn). a Schematic illustration of the principle of the method. A pH-adjusted starting solution of a 1:2 AMP/ATP mixture is treated with AK2 to initiate the reaction. A series of 1D proton NMR spectra as a pseudo-2D are recorded. The intensities of the H8 proton of adenine are extracted and plotted over time. From this, a time constant (τ) is fitted to compare the activity in the presence of different αSyn species. b Concentration-dependent time constant (τ) in the presence of varying concentrations of different αSyn species is given. Data are presented as mean ± SD. The experiment was performed with three αSyn concentrations and n = 3 independent replicates per αSyn concentration (independent addition of αSyn to AK2), except for 0.238 μM of αSyn monomer and 1.2 μM of αSyn fibrils, which were tested with n = 2 replicates. Asterisk indicates statistically significant difference between given condition and control in the absence of αSyn (p-value = 0.0146, two-tailed t-test). Supplementary Fig. 6 shows an orthogonal assay testing the activity of AK2 influenced by αSyn. cg Light scattering aggregation assay of WT (c), ΔC (d), E46K (e), A53T (f), and A30P (g) αSyn at a concentration of 300 μM in PBS pH 7.4 in the absence or presence of varying concentrations of AK2. The experiment was performed in triplicate. Mean values and SD are shown. h SDS-PAGE of αSyn pellet obtained after incubation of αSyn (300 μM) in the absence or presence of AK2 at different concentrations (150 μM, 300 μM, and 600 μM). The molar ratios of AK2 to αSyn are given at the top of the gel. The experiment in (h) was repeated twice independently. Source data are provided as a Source Data file.
Fig. 5
Fig. 5. αSyn conformation-dependent interaction with AK2, DJ1, and ATP synthase.
a Volcano plot shows LiP-MS results on peptides significantly changing upon mitochondrial treatment with αSyn fibrils or monomers for 30 min. Red dots show statistically significant hits (Fold Change > 1.5, q-value < 0.05, based on a two-tailed t-test followed by Benjamini–Hochberg adjustment for multiple hypothesis testing). LiP-MS hits peptides mapped to the protein structure when treated with αSyn monomer or fibrils for AK2 (b), ATP synthase (c), and DJ1 (d). The peptide changes found for AK2 were the same as with αSyn monomers, while for DJ1, only one of two regions found with monomers were also found with αSyn fibrils. Hits passing the q-value cutoff (<0.05) are shown in red. b, d, peptides significant only at a p-value cutoff (<0.05) are shown in pink. p-values were calculated using a two-tailed t-test. FDR adjustment was used for q-value determination. Source data are provided as a Source Data file.
Fig. 6
Fig. 6. Influence of αSyn on ATP hydrolysis in cells.
a Whole cellular ATP content in mice HT-22 cells in the presence of WT and ΔC-αSyn monomers and fibrils. b ATP hydrolytic capacity in isolated mice liver mitochondria after the addition of increasing concentrations of WT and ΔC-αSyn monomers and fibrils. PBS treatment was used as a control, and its hydrolytic activity was set at 100%. Oligomycin A, a potent ATP Synthase inhibitor, was used as a positive control. Statistical significances were calculated with one-way ANOVA followed by Dunnett’s multiple comparisons test. ****p-value < 0.0001, ***p-value < 0.001, **p-value < 0.01, *p -value < 0.05. p-value ≥ 0.05 was considered non-significant. All data are given as mean ± SD. Experiments for each setup were performed on four separate days (a, b). In total, n = 10–12 replicates for (a) and n = 8–15 replicates for (b) were used for each condition. Exact p-values and n for each condition are provided in the Source Data file. Source data are provided as a Source Data file.

References

    1. de Rijk, M. C. et al. A population perspective on diagnostic criteria for Parkinson’s disease. Neurology48, 1277–1281 (1997). - PubMed
    1. Balestrino, R. & Schapira, A. H. V. Parkinson disease. Eur. J. Neurol.27, 27–42 (2020). - PubMed
    1. von Campenhausen, S. et al. Prevalence and incidence of Parkinson’s disease in Europe. Eur. Neuropsychopharmacol.15, 473–490 (2005). - PubMed
    1. McCann, H., Stevens, C. H., Cartwright, H. & Halliday, G. M. Alpha-synucleinopathy phenotypes. Parkinsonism Relat. Disord.20, S62–67 (2014). - PubMed
    1. Theillet, F. X. et al. Structural disorder of monomeric alpha-synuclein persists in mammalian cells. Nature530, 45–50 (2016). - PubMed

LinkOut - more resources