. 2025 Aug 17;16(1):7653.
doi: 10.1038/s41467-025-62919-z.

The pathogenicity and multi-organ proteomic profiles of Mpox virus infection in SIVmac239-infected rhesus macaques

Affiliations

The pathogenicity and multi-organ proteomic profiles of Mpox virus infection in SIVmac239-infected rhesus macaques

Dong Zhang et al. Nat Commun. .

Abstract

Mpox poses a heightened risk of severe disease and mortality among individuals with HIV, yet the molecular mechanisms and immunopathology underlying multi-organ damage caused by the mpox virus (MPXV), particularly in the context of HIV co-infection, remain poorly understood. Here, we observe increased MPXV replication, more extensive skin lesions, and impaired humoral and cellular immune responses in SIV-MPXV co-infected rhesus macaques compared to those infected with MPXV alone. Multi-organ proteomic and phosphoproteomic analyses reveals upregulation of proteins involved in immune and inflammatory pathways in skin lesions and across multiple organs, especially in immune-related tissues. Abnormal activation of DNA replication and cell cycle signaling pathways, which may contribute to enhanced viral replication, is evident in both MPXV and SIV-MPXV co-infected groups. CDK4/6 may present a potential therapeutic target to suppress MPXV replication. These comprehensive proteomic datasets offer valuable insights into the pathogenesis of MPXV in the context of SIV co-infection and support ongoing efforts to mitigate the impact of mpox.


Conflict of interest statement

Competing interests: The authors declare no competing interests.

Figures
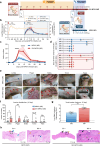
Fig. 1
Fig. 1. Study design and comparison of skin lesions in rhesus macaques from the MPXV and SIV-MPXV groups.
a Study design. Group A (MS, SIV-MPXV, n = 6) and Group B (MP, MPXV, n = 6). b SIV RNA and MPXV DNA loads in the plasma of monkeys before (n = 6) and after 10 dpi (n = 3). The shaded areas within the dashed lines indicate the standard deviation (SD). c,d Skin lesion counts (n = 6 before 10 dpi, n = 3 after 10 dpi) and duration from onset to resolution. Statistical differences between groups were analyzed using two-way ANOVA. ****P < 0.0001. The exact P values are both P < 0.0001 on 10 dpi and 14 dpi (c). The solid triangles indicate the time of skin lesion appearance and healing (d). e Images of skin lesions in monkeys from the MP and MS groups at 10 dpi. f Skin lesion counts at different regions in the MP and MS groups at 10 dpi (n = 6). Statistical differences between groups were analyzed using two-way ANOVA with Tukey’s correction for multiple comparisons. *P < 0.05, **P < 0.01. The exact P-values are: P = 0.0302 in the limbs and P = 0.0068 in the pygal. g MPXV DNA loads in skin lesions in the MP and MS groups (n = 3). Statistical differences were analyzed by a two-tailed unpaired t test. **P < 0.01 (P = 0.0022). h Histopathology of skin lesions in macaques after the MPXV challenge. The black arrows represent necrotic cell fragments and granulocytes, the gray arrows refer to fibrous cell necrosis, the purple arrows indicate inflammatory cell infiltration mainly composed of lymphocytes and granulocytes, the orange arrows point to an increase in the number of spinous cell layers, the blue arrows show loose arrangement of connective tissue, and the dark blue arrows show mild edema. Data are shown as the mean ± SD (b, c, f, g). The ‘n’ represents the number of independent biological replicates. Source data are provided as a Source Data file.
Fig. 2
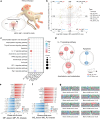
Fig. 2. Proteomic and phosphoproteomic differences in skin lesions of rhesus macaques between the MP and MS groups.
a Schematic diagram of skin lesion sampling. ‘MP’ represents the MPXV-alone group, ‘MS’ refers to the SIV-MPXV group, and ‘PL’, peripheral lesion, indicates the adjacent normal skin tissues. The lesions used for omics analysis were collected from the limbs of the monkeys. Created in BioRender. Yang, C. (2025) https://BioRender.com/v95xk7r. b Scatter plots showing differentially expressed skin lesion proteins in the MP/control (Ctr) and MS/Ctr comparison groups. According to fold changes and Student’s t test P-adjust values (two-sided) in the MP/Ctr and MS/Ctr comparison groups, nine protein expression modes were identified. See also Supplementary Data S2. c KEGG enrichment results (Fisher’s exact test P < 0.05, two-sided) for proteins in each expression mode in (b). See also Supplementary Data S2. d PPI networks of proteins in the significantly enriched pathways in (c). e,f Kinase prediction results comparing MP to Ctr (e) or MS to Ctr (f) skin lesions. Kinases were predicted using GPS software (setting organism at Macaca mulatta and threshold at medium). Kinase activities were predicted using GSEA. Red indicates (GSEA P < 0.05 and NES > 1) activated kinases, while blue indicates inhibited ones (GSEA P < 0.05 and NES < − 1). See also Supplementary Data S4. g Enriched motifs among kinase substrate phosphosites. Reliable phosphosites were submitted to GPS software to identify kinase-substrate relationships. Peptide sequences containing all kinase substrate phosphosites were uploaded to MoMo (Motif-x algorithm) to identify motifs.
Fig. 3
Fig. 3. Multi-organ proteomic and phosphoproteomic analysis.
a MPXV DNA loads in multiple organs sampled from rhesus macaques necropsied at 10 days post-MPXV infection (dpi). The intensity of blue in the heatmap indicates the level of MPXV DNA load in each organ. The organs were categorized into four classes: lymph nodes, immune tissues, gut, and other tissues. b Study design for the proteomic and phosphoproteomic analysis using eight organs in the MP and MS groups. Created in BioRender. Yang, C. (2025) https://BioRender.com/3zt44aw. c Reliable proteins in eight organs of MP and MS groups. Differentially expressed proteins were calculated using Student’s t test (two-sided, thresholds set at P-adjust < 0.05 and FC > 1.5 or FC > (1/1.5)) in each organ comparing MP to Ctr or MS to Ctr. d Reliable phosphosites in eight organs of the MP and MS groups. Differentially expressed phosphosites were calculated using Student’s t test (two-sided, thresholds set at P-adjust < 0.05 and FC > 1.5 or FC > (1/1.5)) in each organ comparing MP to Ctr or MS to Ctr. e KEGG enrichment results (Fisher’s exact test P < 0.05, two-sided) for unique upregulated or downregulated proteins in each organ comparing the MS to MP group. The red and blue arrows at the bottom of the panel respectively indicate the upregulated and downregulated proteins in the corresponding columns. f Kinase prediction results comparing the MS to the MP group in each organ. Kinases were predicted using GPS software (setting organism at Macaca mulatta and threshold at medium). Kinase activities were predicted using GSEA. The ‘*’ symbol indicates the marked kinase had significantly changed activity (GSEA P < 0.05 and |NES | > 1). Source data are provided as a Source Data file.
Fig. 4
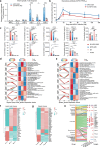
Fig. 4. Impaired humoral and cellular immune responses to MPXV infection in chronically SIV-infected rhesus macaques.
a VACV-specific CD4+ and CD8+ T-cell immune responses measured by TNF-α, IFN-γ, and IL-2 intracellular cytokine staining (ICS) assays at 28 days post-MPXV infection (dpi, n = 3). Statistical differences were analyzed using two-way ANOVA with Tukey’s correction for multiple comparisons. *P < 0.05, ****P < 0.0001. The exact P-values of IFN-γ, IL-2, and TNF-α level differences in CD8+ T cell immune responses between MPXV (MP) and SIV-MPXV (MS) groups are: P < 0.0001, P = 0.0107 and P < 0.0001. b Neutralizing antibody titers against MPXV of the MP and MS groups (n = 6 before 10 dpi, n = 3 after 10 dpi). Statistical differences were analyzed using two-way ANOVA and Šídák’s multiple comparisons test (*P <  0.05, P = 0.0139). c Plasma cytokine and chemokine levels of the MS and MP groups at 10 dpi, and of SIV-infected alone macaques at two months post-SIV infection with stable SIV viral load (n = 6). Statistical differences were analyzed using two-way ANOVA with Tukey’s correction for multiple comparisons. **P < 0.01, *** P < 0.001, ****P < 0.0001. The exact P-values were shown in the Supplementary Notes for the Figure legends of Fig.4c. d,e Expression trends of differentially expressed proteins (one-way ANOVA P < 0.05) among control (Ctr), MP, and MS groups in the inguinal lymph node (ILN, d) and spleen (e). f,g Kinase prediction results among Ctr, MP, and MS groups in the ILN (f) and Spleen (g). Kinases were predicted using GPS software (setting organism at Macaca mulatta and threshold at medium). Kinase activities were predicted using GSEA. The green to red color indicates kinase activity (GSEA NES values). h Sankey plots showing relationships of drugs and kinases in the ILN and spleen. Red symbols indicate activated kinases, while blue symbols indicate inhibited ones. Data are shown as the mean ± SD (ac). The ‘n’ represents the number of independent biological replicates. Source data are provided as a Source Data file.

References

    1. Ogoina, D. et al. Clinical course and outcome of human monkeypox in nigeria. Clin. Infect. Dis.71, e210–e214 (2020). - PubMed
    1. Taylor, L. WHO and African CDC declare mpox a public health emergency. BMJ386, q1809 (2024). - PubMed
    1. CDC), A. C. f. D. C. a. P. A. Africa CDC declares mpox a public health emergency of continental security, mobilizing resources across the continent. (2024).
    1. Thornhill, J. P., Gandhi, M. & Orkin, C. Mpox: The reemergence of an old disease and inequities. Annu. Rev. Med.75, 159–175 (2024). - PubMed
    1. WHO. Global Mpox Trends. https://worldhealthorg.shinyapps.io/mpx_global/. (2024).

MeSH terms

LinkOut - more resources