. 2025 Aug 16;16(1):7638.
doi: 10.1038/s41467-025-62956-8.

Cholecystectomy-related gut microbiota dysbiosis exacerbates colorectal tumorigenesis

Affiliations

Cholecystectomy-related gut microbiota dysbiosis exacerbates colorectal tumorigenesis

Bo Tang et al. Nat Commun. .

Abstract

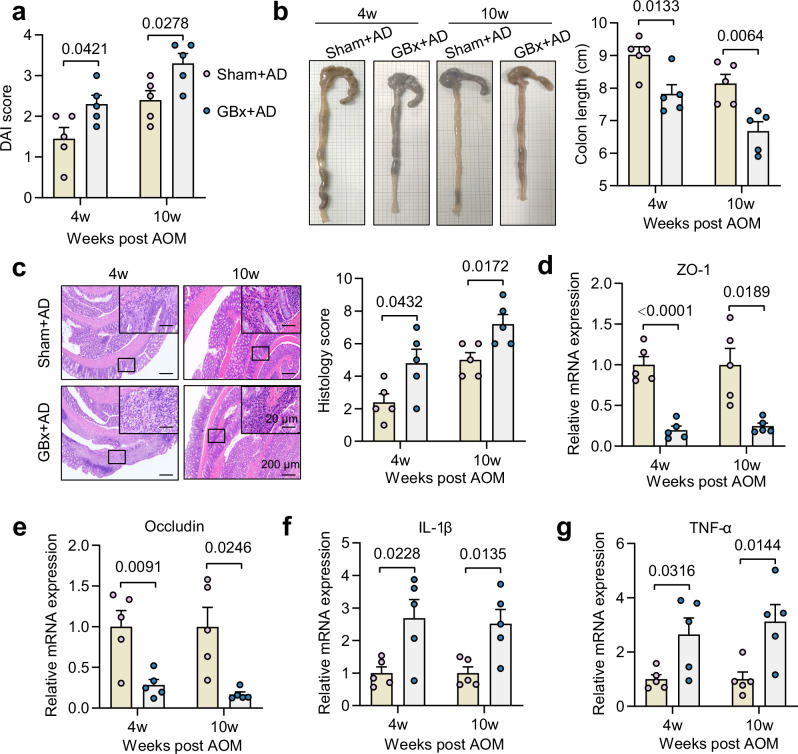
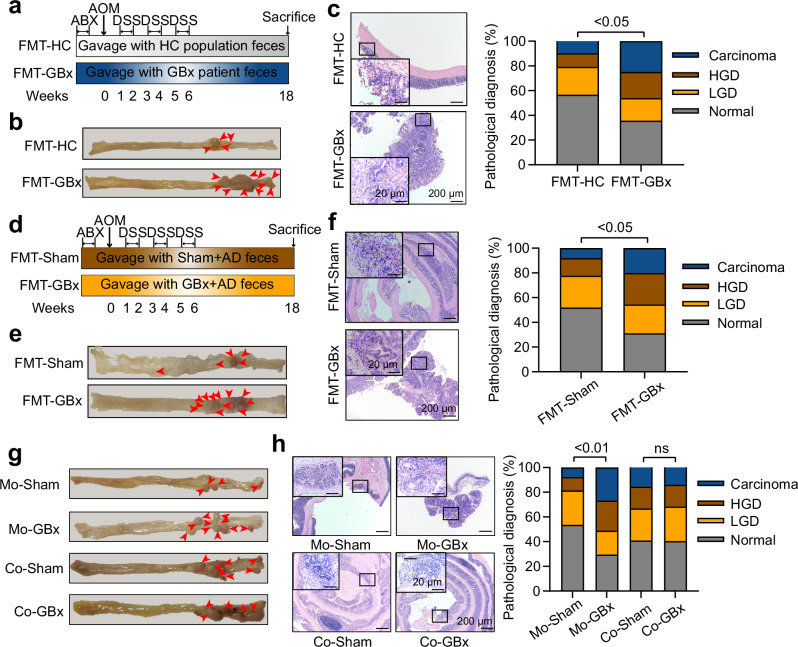
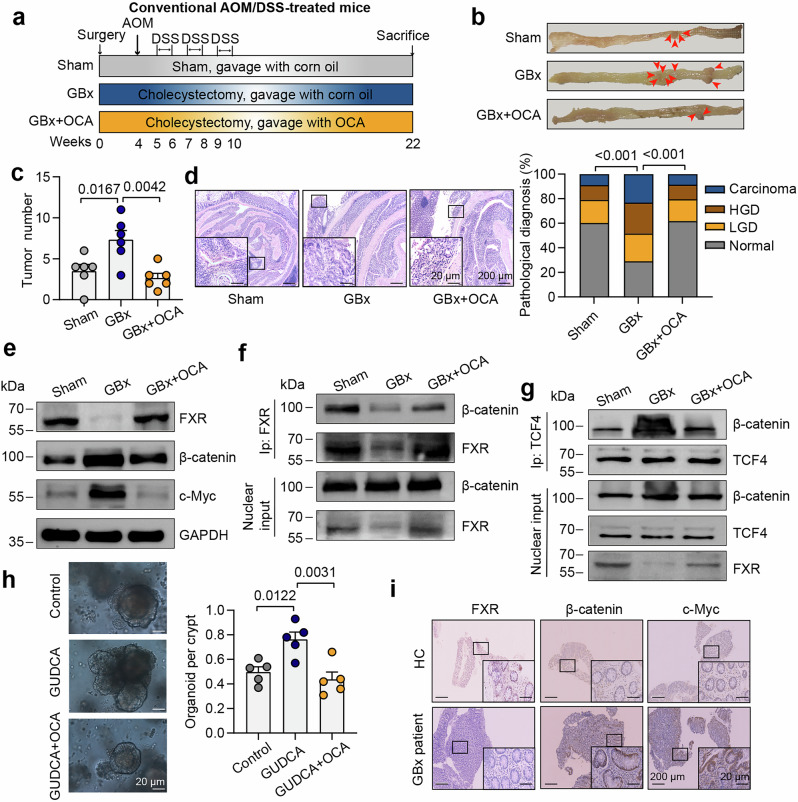
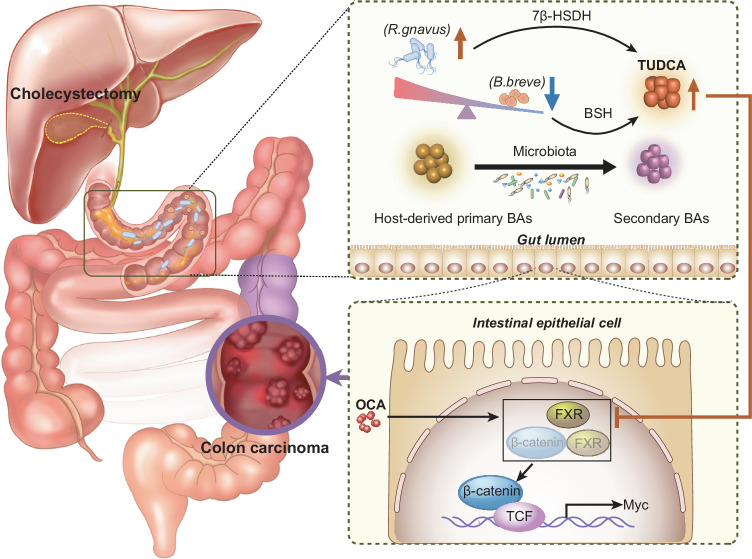
Cholecystectomy represents the most prevalent biliary surgical procedure for gallbladder abnormalities. Growing evidence suggests that cholecystectomy is associated with an elevated risk of colorectal cancer. However, the underlying mechanism remains elusive. Here we show that cholecystectomy exacerbates colorectal tumorigenesis in both AOM/DSS and APCmin/+ mice models. Metagenomic sequencing and targeted metabolomics show that cholecystectomy leads to a decrease of Bifidobacterium breve (B. breve) and an increase of Ruminococcus gnavus (R. gnavus), along with increased levels of glycoursodeoxycholic acid (GUDCA) in human and tauroursodeoxycholic acid (TUDCA) in mice. Fecal microbiota transplantation, single bacterial colonization and bile acid supplementation demonstrate that cholecystectomy-related gut microbiota perturbations promote the production of TUDCA and facilitate colorectal tumorigenesis. RNA-sequencing and co-immunoprecipitation reveal that the compromised bile acid metabolism inhibits farnesoid X receptor (FXR) signaling, disrupts the FXR/β-catenin interaction, and ultimately exacerbates colorectal tumorigenesis. Significantly, FXR agonist obeticholic acid (OCA) averts cholecystectomy-related colorectal tumorigenesis. The gut microbiota holds a crucial position in cholecystectomy-induced colorectal tumorigenesis, and modulation of the gut microbiota-bile acid-FXR axis represents a promising preventive strategy.


Conflict of interest statement

Competing interests: The authors declare no competing interests.

Figures

Fig. 1
Fig. 1. Cholecystectomy exacerbates colorectal tumorigenesis in C57BL/6 mice.
a Schematic diagram showing the experimental design and timeline. b The body weight of mice (two-tailed t test was used at the end point, n = 7/group). c Representative colonoscopy images of mice (n = 3/group). Macroscopic tumors were present in GBx+AD mice but no obvious tumor was observed in Sham+AD mice. d Colonic morphologies. Each red arrow points at one tumor location (n = 7/group). e Tumor number (left) (n = 7/group) and tumor size distribution (right). f Representative H&E staining of mouse colons (left). H&E staining showed normal, dysplastic mucosae and carcinoma in the colon tissues. The pathological score was quantitative analyzed (right) according to the following criteria: 0 for normal; 1 for LGD; 2 for HGD and 3 for carcinoma (ANOVA, n = 7/group). The bottom scale bar is 200 μm and the top scale bar is 20 μm. g Intestinal permeability was measured by FITC-dextran (two-tailed Welch’s t test, n = 7/group). h Representative images and semiquantitative analysis of Ki67 staining of mouse colons (n = 7/group). i Serum CEA (upper) and CA19-9 (lower) levels in the two groups (n = 7/group). Data are shown as the mean ± SEM. P values were determined by two-tailed t test for e, h, i and were indicated in each figure. GBx, cholecystectomy; AOM, azoxymethane; DSS, dextran sodium sulfate; AD, AOM/DSS; CEA, carcinoembryonic antigen; CA19-9, cancer antigen 19-9; LGD: low grade dysplasia; HGD: high grade dysplasia. Source data are provided as a Source Data file.
Fig. 2
Fig. 2. Cholecystectomy exacerbates colitis in AOM/DSS mouse model.
a DAI score of Sham+AOM/DSS and GBx+AOM/DSS mice at week 4 and 10 after AOM injection. b Representative macrograph of colons and colon length. c H&E staining of colon tissue (left) and histological score (right). Histological slides showed acute inflammation at 4 weeks and chronic inflammation at 10 weeks following AOM injection. The bottom scale bar is 200 μm, and the top scale bar is 20 μm. d–g Relative expression of ZO-1 (d), Occludin (e), IL-1β (f) and TNF-α (g) in colonic tissues. n = 5/group. Data are shown as the mean ± SEM. P values were determined by a two-tailed t test and were indicated in each figure. DAI, disease activity index; ZO-1, tight junction protein 1; IL-1β, interleukin-1β; TNF-α, tumor necrosis factor alpha. All data are representative of more than three independent experiments. Source data are provided as a Source Data file.
Fig. 3
Fig. 3. Cholecystectomy exacerbates colorectal tumorigenesis in a gut microbiota-dependent manner.
a Experimental design for patient FMT mouse model. b Representative images of mouse colons (n = 6/group). c Representative images of H&E staining (left) and semiquantitative analysis (right) (n = 6/group). H&E staining presented normal mucosa, dysplastic mucosae, and carcinoma in the colon tissues. d Schematic overview of mouse fecal FMT model. e Representative images of the colon (n = 5/group). f Representative images of H&E staining (left) and semiquantitative analysis (right) (n = 5/group). H&E staining showed normal, dysplastic mucosae and carcinoma in the colon tissues. g Representative images of the colon in the cohousing experiments (n = 7/group). h Representative images of H&E staining (left) and semiquantitative analysis (right) in each group (n = 7/group). H&E staining showed normal, dysplastic mucosae and carcinoma in the colon tissues. The bottom scale bar is 200 μm and the top scale bar is 20 μm for c, f, and h. Data are shown as the mean ± SEM. P values were determined by ANOVA. ns not significant, FMT fecal microbiota transplantation, Mo mono-housed, Co co-housed. Source data are provided as a Source Data file.
Fig. 4
Fig. 4. The gut microbiota profiles in cholecystectomy patients and mice models.
a α-diversity of the gut microbiota at all levels in HC and GBx patients (two-tailed Welch’s t test). b NMDS of bacterial communities based on Bray-Curtis similarity. c VIP score of the PLS-DA in gut microbiota. VIP scores were used to rank the ability of different taxa to discriminate between the two groups. A taxon with VIP score > 2.0 was considered important in the discrimination. d Index (α-diversity) of the gut microbiota between Sham+AOM/DSS and GBx+AOM/DSS mice. (two-tailed Welch’s t test, n = 7 vs 9). The center line of the boxplot represents the median; the box spans from the first quartile (Q1) to the third quartile (Q3); the whiskers extend from the box to the maximum and minimum values within 1.5 times the interquartile range (IQR) from the box. e NMDS of bacterial communities based on Bray-Curtis similarity (n = 7 vs 9). f VIP score of the PLS-DA. VIP scores were used to rank the ability of different taxa to discriminate between the two groups. A taxon with VIP score > 2.0 was considered important in the discrimination (n = 7 vs 9). g Relative abundance (percent reads) of B. breve between healthy and cholecystectomy patients based on metagenomics sequencing. h Relative abundance (percent reads) of R. gnavus between healthy and cholecystectomy patients based on metagenomics sequencing. i The relative abundance of B. breve between the Sham+AD and GBx+AD group (n = 7 vs 9). j Relative abundance of R. gnavus between Sham+AOM/DSS and GBx+AOM/DSS mice (n = 7 vs 8). k qPCR analysis of B. breve abundance in Sham and GBx mice (n = 5 vs 6). l qPCR analysis of R. gnavus in Sham and GBx mice (two-tailed t test, n = 5 vs 6). m qPCR analysis of B. breve abundance in APC-Sham and APC-GBx mice (n = 6/group). n qPCR analysis of R. gnavus in APCmin/+ mice (two-tailed Welchs t test, n = 6/group). Data are shown as the mean ± SEM. P values were determined by two-tailed Mann-Whitney U test for g–k, m, and were indicated in each figure. HC healthy control, AD AOM/DSS, NMDS nonmetric multidimensional scaling, VIP variable importance in projection, B. breve, Bifidobacterium breve, R. gnavus Ruminococcus gnavus. Source data are provided as a Source Data file.
Fig. 5
Fig. 5. B. breve- and R. gnavus-mediated bile acid metabolism is involved in colorectal tumorigenesis.
a Individual bile acid levels of mice gavaged with control, B. breve or R. gnavus (n = 6/group). b The ratio of conjugated to unconjugated bile acids in feces (n = 6/group). c The ratio of secondary to primary bile acids in feces (n = 6/group). P values were determined by ANOVA for a-c. d The hydrolysis efficiency of GUDCA mediated by B. breve (n = 5/group). e Relative BSH activity of Sham+AOM/DSS and GBx+AOM/DSS mice (n = 7/group). f The activity of 7β-HSDH mediated by R. gnavus (n = 4/group). g Relative 7β-HSDH activity of Sham+AOM/DSS and GBx+AOM/DSS mice (n = 7/group). P values were determined by two-tailed t test for d–g. h, i Representative images of mouse colon (h) and H&E staining (i). Mice were gavaged with B. breve or R. gnavus and then treated with BSH inhibitor riboflavin or 7β-HSDH inhibitor UDCA, respectively (n = 7/group). H&E staining showed normal, dysplastic mucosae and carcinoma in the colon tissues. The bottom scale bar is 200 μm and the top scale bar is 20 μm. j, k Representative images of mouse colon (j) and H&E staining (k). Mice were treated with GUDCA or TUDCA after the AOM/DSS model was established (n = 8/group). H&E staining showed normal, dysplastic mucosae and carcinoma in the colon tissues. The bottom scale bar is 200 μm and the top scale bar is 20 μm. Data are shown as the mean ± SEM. P values are indicated in each figure. AD: AOM/DSS; B. breve, Bifidobacterium breve; R. gnavus, Ruminococcus gnavus; BSH bile salt hydrolase, BAs bile acids, c/u BAs, conjugated to unconjugated bile acids, s/p BAs secondary to primary bile acids; 7β-HSDH, 7β-hydroxysteroid dehydrogenase, UDCA ursodeoxycholic acid, Ribo riboflavin. Source data are provided as a Source Data file.
Fig. 6
Fig. 6. FXR/β-catenin signaling is involved in cholecystectomy-related colorectal tumorigenesis.
a Volcano plot of RNA-seq analysis of colon cancerous tissue. The upregulated genes (green) and the downregulated genes (red) with a fold change <0.6 (n = 3/group) were shown. P values were adjusted by Benjamini & Hochberg (BH) method to control FDR. FDR-adjusted P < 0.05 was shown. b GSEA of the changes in the FXR pathway genes between Sham+AOM/DSS and GBx+AOM/DSS group (n = 3/group). Negative NES indicates that the level is lower in GBx+AOM/DSS group. c Relative expression of FXR in colon cancerous tissues (n = 7/group). d Relative expression of SHP in colon cancerous tissues (n = 6 vs 5). e KEGG pathway analysis of Sham+AOM/DSS and GBx+AOM/DSS mice (n = 3/group). P values were adjusted by BH method to control FDR. FDR-adjusted P < 0.05 was shown. f Relative expression of MYC in colon cancerous tissues (n = 7/group). g Western blot analysis of FXR, β-catenin, c-Myc, and GAPDH within the colon cancerous tissues from Sham+AOM/DSS and GBx+AOM/DSS mice. GAPDH was used as a loading control. h Immunofluorescence analysis of β-catenin (n = 7/group). β-Catenin, green; DAPI, blue. Scale bar, 20 μm. i Representative image of IHC staining of FXR, β-catenin, and c-Myc (n = 7/group). The bottom scale bar is 200 μm and the top scale bar is 20 μm. j Co-immunoprecipitation analysis of the interaction between FXR and β-catenin in colon cancerous tissues. k Co-IP of the interaction between TCF4 and β-catenin in colon cancerous tissues. Data are shown as the mean ± SEM. P values were determined by two-tailed t test and were indicated in each figure. FXR farnesoid X receptor, SHP small heterodimer partner, TCF transcription factor. All data are representative of more than three independent experiments. Source data are provided as a Source Data file.
Fig. 7
Fig. 7. OCA prevents cholecystectomy-induced colorectal tumorigenesis.
a Schematic overview shows OCA treatments in the sham or cholecystectomy mice with AOM/DSS treatment. b Representative images of the colon (n = 6/group). c Average tumor number (n = 6/group). d Representative images of H&E staining (left) and semiquantitative analysis (right) (n = 6/group). H&E staining showed normal, dysplastic mucosae and carcinoma in the colon tissues. The bottom scale bar is 200 μm and the top scale bar is 20 μm. e Protein expression of FXR, β-catenin, c-Myc, and GAPDH within the colon cancerous tissues for each group. f Co-immunoprecipitation of the interaction between FXR and β-catenin in colon cancerous tissues. g Co-immunoprecipitation of the interaction between TCF4 and β-catenin in colon cancerous tissues. h Representative image and quantification of organoids generated from GBx+AOM/DSS mice treated with control, GUDCA (100 μM), or GUDCA + OCA (10 μM) (n = 5/group). Scale bar, 20 μm. i IHC staining of FXR, β-catenin, and c-Myc in healthy controls and cholecystectomy patients in colon tissues. (n = 4/group). The bottom scale bar is 200 μm and the top scale bar is 20 μm. Data are shown as the mean ± SEM. P values were determined by ANOVA and were indicated in each figure. HC healthy control, GBx cholecystectomy, OCA obeticholic acid. Source data are provided as a Source Data file.
Fig. 8
Fig. 8. Conceptual diagram illustrating the potential interaction between cholecystectomy and colon carcinoma.
Cholecystectomy can induce gut microbiota disorder, characterized by a significant decrease in the abundance of B. breve and an increase in the abundance of R. gnavus. The reduction in B. breve elevates the level of TUDCA via its BSH activity. Meanwhile, the augmented R. gnavus can promote the formation of TUDCA through its 7β-HSDH activity. TUDCA may ultimately lead to colon carcinoma by disrupting the interaction between FXR and β-catenin, which could further increase the binding of β-catenin and TCF4, thereby promoting MYC expression and facilitating colorectal tumorigenesis. OCA treatment may ultimately prevent colon carcinoma through FXR activation. The schematic was created using Adobe Illustrator 2024 (v28.7.0). B. breve, Bifidobacterium breve, R. gnavus, Ruminococcus gnavus; TUDCA tauroursodeoxycholic acid, 7β-HSDH 7β-hydroxysteroid dehydrogenase, BSH bile salt hydrolase, FXR farnesoid X receptor, TCF4 transcription factor 4, OCA obeticholic acid.

References

    1. Unalp-Arida, A. & Ruhl, C. E. Increasing gallstone disease prevalence and associations with gallbladder and biliary tract mortality in the US. Hepatology77, 1882–1895 (2023). - PubMed
    1. Ahmad, D. S. & Faulx, A. Management of postcholecystectomy biliary complications: a narrative review. Am. J. Gastroenterol.115, 1191–1198 (2020). - PubMed
    1. Konyn, P. et al. Gallstone disease and its association with nonalcoholic fatty liver disease, all-cause and cause-specific mortality. Clin. Gastroenterol. Hepatol.21, 940–948.e2 (2023). - PubMed
    1. Di Ciaula, A., Garruti, G., Wang, D. Q. & Portincasa, P. Cholecystectomy and risk of metabolic syndrome. Eur. J. Intern. Med.53, 3–11 (2018). - PMC - PubMed
    1. Schernhammer, E. S. et al. Cholecystectomy and the risk for developing colorectal cancer and distal colorectal adenomas. Br. J. Cancer88, 79–83 (2003). - PMC - PubMed

MeSH terms

LinkOut - more resources