. 2025 Aug 16;16(1):7640.
doi: 10.1038/s41467-025-62999-x.

Bioinspired ruthenium-manganese-oxygen complex for biocatalytic and radiosensitization therapies to eradicate primary and metastatic tumors

Affiliations

Bioinspired ruthenium-manganese-oxygen complex for biocatalytic and radiosensitization therapies to eradicate primary and metastatic tumors

Ruidan Li et al. Nat Commun. .

Abstract

Designing efficient, biocompatible radiation-sensitive materials to activate systemic immune responses can maximize tumoricidal effects against malignant tumors. Here, inspired by natural Mn-peroxidase, we propose the de novo design of the RuMn-oxygen complex (MnBTC-Ru) for biocatalytic and radiosensitization therapies to eradicate primary and metastatic tumors. Our results reveal that Mn-organic ligands can enhance the electron density of Ru clusters, thereby optimizing their binding to oxygen species and resulting in high reactive oxygen species and oxygen generation. Accordingly, MnBTC-Ru with radiation can enhance cell membrane and DNA damage, triggering apoptosis though oxidative damage, heightening radiosensitization, and activating CD8+ T cells. When combined with anti-PD-1 therapy, this synergistic approach generates robust systemic antitumor responses in female mice, promoting the abscopal effect and establishing enduring immune memory against tumors, thereby reducing recurrence and metastasis. This design presents superior biocatalytic and radiosensitizing properties, which may provide promising and practical bio-nanotechnology for future treatments on eradicating primary and metastatic tumors.


Conflict of interest statement

Competing interests: The authors declare no competing interests.

Figures

Fig. 1
Fig. 1. Design and structure characterizations of MnBTC-Ru complex.
a Schematic illustration of the synthesis of MnBTC-Ru complex and its role as a biocatalytic and radiosensitive agent that activates systemic antitumor response, facilitating the eradication of primary and metastatic tumors. b Natural Mn-peroxidase-inspired construction of RuMn-oxygen complex for ROS biocatalysis. c FTIR spectrum of MnBTC-Ru and MnBTC. d SEM, e TEM, and f HAADF-STEM images of MnBTC-Ru. g Diameter analysis of Ru clusters on MnBTC-Ru. h Atomic-resolution HAADF-STEM image of MnBTC-Ru. i, j EDS mapping and k EDS spectra of MnBTC-Ru. Experiments were repeated independently (df, hj) three times with similar results. In (a), ICD indicates immunogenic cell death, HMGB1 indicates high mobility group box-1, DC indicates dendritic cell, CRT indicates cell surface calreticulin, ATP indicates adenosine triphosphate. Atomic color coding in (a, b): Ru, yellow; Mn, blue; C, khaki; H, white; O, purple. In (i), Mix indicates mixture. In (c, g, k), a.u. indicates the arbitrary units. Source data are provided as a Source Data file.
Fig. 2
Fig. 2. Analysis of precise atomic coordination structures in MnBTC-Ru complex.
The high-resolution XPS of a O 1s, b Mn 2p, and c Ru 3p for different catalysts. d Ru K-edge XANES spectra of MnBTC-Ru and references (Ru foil, RuCl3, and RuO2). e Valence analysis of Ru species in MnBTC-Ru. f WT images of Ru K-edge EXAFS for different samples. Colour gradients have no units; the magnitude of the value indicates the intensity. g Ru k2-weighted Fourier transform (FT) spectra in R-space. h DOS analysis of Ru 4d orbital of Ru particles, C-Ru, and MnBTC-Ru. i Differential charge density analysis of Ru centers (yellow and cyan represent charge accumulation and depletion, respectively, with a cutoff value of 0.002 e·Bohr-3 for the density-difference isosurface). Atomic color coding in the structure: Ru, yellow; Mn, blue; C, khaki; H, white; and O, purple. In (b), Sat. indicates the satellite peak. In (ad), a.u. indicates the arbitrary units. Source data are provided as a Source Data file.
Fig. 3
Fig. 3. Evaluation of enzyme-mimetic ROS-biocatalytic activities.
a Schematic diagram of the dual-functional capabilities of O2 and ROS generation for MnBTC-Ru, the control biocatalyst (C-Ru) shows sluggish kinetics. b The produced O2 concentration that measured by an oxygen dissolving meter with the presence of biocatalysts and H2O2. c Peroxidase-mimetic activity of different catalysts (n = 3 independent experiments, data are presented as mean ± SD). d Active site poison tests of the biocatalytic MnBTC-Ru complex via KSCN (n = 3 independent experiments, data are presented as mean ± SD). e Relative peroxidase-like activity, Vmax, Km, and TON values of MnBTC-Ru and C-Ru. f Comparison of the TON and Vmax values with reported enzyme-mimetic catalysts. g •O2- detected by HE. h 1O2 detected by DPA. EPR spectra for recording the i •O2- signal and the j 1O2 signal. k In-situ FTIR spectrum and l the corresponding contour plot of MnBTC-Ru for the peroxidase-like process. m Differential charge density analysis of Ru centers (yellow and cyan represent charge accumulation and depletion, respectively, with a cutoff value of 0.005 e·Bohr-3 for the density-difference isosurface). Ru, yellow; Mn, blue; C, khaki; H, white; O, purple. n Calculated Bader charge of MnBTC-Ru and C-Ru with the adsorption of a *OOH intermediate. o DOS (where Ru corresponds to the d orbital, and OOH is the superposition of s and p orbitals for O and H) of MnBTC-Ru and C-Ru with the adsorption of an *OOH intermediate. Statistical significance was assessed using the Student’s t-test for two-group comparisons and one-way ANOVA for multiple-group comparisons, followed by Tukey’s two-tailed post-hoc test for pairwise analysis, all tests were two-sided. In (ce, gl), a.u. indicates the arbitrary units. Source data are provided as a Source Data file.
Fig. 4
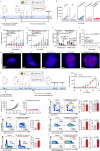
Fig. 4. In vitro biocatalytic and radiosensitizing antitumor effects of MnBTC-Ru complex.
a A schematic illustration of the in vitro antitumor activities of MnBTC-Ru. b The representative fluorescence images and c quantitative flow cytometry show the ROS generation in CT26 cells in different groups (n = 3 independent replicates; scale bar = 100 μm). d The intracellular ATP of CT26 in different groups (n = 3 independent replicates). e LPO product MDA detection of CT26 cells after different treatments (n = 3 independent replicates). f The expression of HIF-1α in CT26 subjected to different treatments (scale bar = 50 μm). g The Annexin V/PI analysis of CT26 cells in different groups (n = 3 independent replicates). The graph showed the percentage of apoptotic cells (early apoptotic, late apoptotic) in different groups (n = 3 independent replicates). h Live/Dead analysis of CT26 cells after different treatments, Green: live cells; Red: dead cells (scale bar = 100 μm). i Transwell migration assay is used to evaluate cell migration, and the graphs show the numbers of migrated cells in different groups (n = 3 independent replicates). j A schematic diagram of ICD of tumor cells releasing DAMPs and interacting with dendritic cells. k The ATP release of CT26 in different groups (n = 3 independent replicates). l The representative fluorescence images show the expression of CRT in CT26 after different treatments (scale bar = 10 μm). Experiments were repeated independently (b, c, f, h, l) three times with similar results. DAPI indicates 4′,6-diamidino-2-phenylindole, PI indicates propidium iodide, FITC indicates fluorescein isothiocyanate, Calcein-AM indicates calcein acetoxymethyl ester. Results are presented as means ± SD. Statistical significance was assessed using the Student’s t-test for two-group comparisons and one-way ANOVA for multiple-group comparisons, followed by Tukey’s two-tailed post-hoc test for pairwise analysis, all tests were two-sided. Source data are provided as a Source Data file.
Fig. 5
Fig. 5. In vivo tumoricidal effects and enhanced antitumor responses of RT + MnBTC-Ru to inhibit primary tumor progression.
a Schematic illustration of RT+MnBTC-Ru treatment. b Average tumor growth curves, c individual tumor growth kinetics, d tumor weight, and e body weight of CT26 tumor-bearing mice after different treatments (n = 5 biologically independent mice per group). f Representative H&E and fluorescent staining images (TUNEL assay, γ-H2AX and Ki67 staining) from tumor tissue section (scale bar = 100 μm). g Representative H&E-stained images from major organ tissue section (scale bar = 100 μm). h Results of blood chemistry parameters from mice after different treatments (n = 3 independent replicates). Blood chemistry parameters include white blood cell (WBC), red blood cell (RBC), platelet count (PLT), hemoglobin (HGB), alanine aminotransferase (ALT), aspartate aminotransferase (AST), creatinine (CREA), albumin (ALB), and Creatine Kinase (CK). i Representative flow cytometric analysis and relative quantification of CD3+ T cells, CD8+ T cells, and CD8+CD69T cells (n = 3 independent replicates). In (bi), the Control group indicates saline. Experiments were repeated independently (f, g) three times with similar results. Ki67 indicates Marker of Proliferation Ki67, γ-H2AX indicates phosphorylated histone H2A.X at Ser139, SSC-A indicates Side Scatter Area, BUV395 indicates Brilliant Ultraviolet 395, BUV661 indicates Brilliant Ultraviolet 661, BV771 indicates Brilliant Violet 771, PE-Cy7 indicates Phycoerythrin–Cyanine 7. Results are presented as means ± SD. Statistical significance was determined using the one-way ANOVA for multiple-group comparisons, followed by Tukey’s two-tailed post-hoc test for pairwise analysis, all tests were two-sided. Source data are provided as a Source Data file.
Fig. 6
Fig. 6. In vivo fate of MnBTC-Ru and its reprogramming of the TME.
a Biodistribution of MnBTC-Ru in the tumor, liver, kidneys, feces, and urine of mice at different time points after intratumoral injection of MnBTC-Ru (n = 3 independent replicates). b Reconstruction of the skeletal structure, MnBTC-Ru (blue), and tumor (red) in mice based on CT scans at different time points. c PCA and d Venn diagram of differential expression genes in RNAseq between Control, RT, and RT+MnBTC-Ru treated tumors after 12 days post-treatment (n = 3 independent replicates). e The top 50 differential expression genes in Control, RT, and RT+MnBTC-Ru groups. Colour gradients have no units; the magnitude of the value indicates the Gene relative expression level. f GO enrichment analysis of differentially expressed genes (n = 3 independent replicates). g GSEA for the altered gene sets in the RT+MnBTC-Ru treatment group. In (a-e), the Control group indicates saline. Experiments were repeated independently (b) three times with similar results. PCA indicates principal component analysis, ES indicates enrichment score, FDR indicates false discovery rate. Results are presented as means ± SD. In (f), p-value obtained from one-sided Hypergeometric test without multiple comparisons. In (g), p-value obtained from two-sided, rank-based permutation test, with significance determined by FDR adjustment for multiple comparisons. Source data are provided as a Source Data file.
Fig. 7
Fig. 7. RT+MnBTC-Ru and anti-PD-1 combined therapies with abscopal responses and long-term antitumor memory effects to eradicate metastatic tumors.
a Schematic illustration of RT+MnBTC-Ru with anti-PD-1 treatment (i.p., intraperitoneal). b Individual tumor growth kinetics of distant tumor, average tumor growth curves of c primary tumor and d distant tumor, e tumor weight, and f body weight of bilateral CT26 tumor-bearing mice after different treatments (n = 5 biologically independent mice per group). g Representative immunofluorescence images from lymph node slices stained with DAPI (blue) and CD8 (red) antibodies (scale bar = 400 μm). h Schematic illustration of the experiment design to assess the antitumor memory responses triggered by RT+MnBTC-Ru+anti-PD-1 combination therapy. i Average tumor growth curves and j individual tumor growth kinetics of the treated mice (n = 5 biologically independent mice per group). ko Representative flow cytometric analysis of Control and RT+MnBTC-Ru+anti-PD-1 group, with corresponding quantification of CD45+, CD3+ T, CD8+ T and CD4+ T cells, and subsets Tcms (CD62L+CD44+) and Tems (CD62L-CD44+) from CD8+ and CD4+ T cells in the spleen (n = 3 independent replicates). In (b-g) and (i-o), the Control group indicates saline. Experiments were repeated independently (g) three times with similar results. L/D indicates Live/Dead, FVS440UV indicates Fixable Viability Stain 440UV, APC-Cy7 indicates Allophycocyanin–Cyanine 7, PerCP-Cy5.5 indicates Peridinin–Chlorophyll–Protein–Cyanine 5.5. Results are presented as means ± SD. Statistical significance was determined using the Student’s t-test for two-group comparisons, and one-way ANOVA for multiple-group comparisons, followed by Tukey’s two-tailed post-hoc test for pairwise analysis, all tests were two-sided. Source data are provided as a Source Data file.

References

    1. Yi, K. et al. Engineered nanomaterials to potentiate CRISPR/Cas9 gene editing for cancer therapy. Adv. Mater.36, 2300665 (2024). - PubMed
    1. Yue, W. et al. Checkpoint blockade and nanosonosensitizer-augmented noninvasive sonodynamic therapy combination reduces tumour growth and metastases in mice. Nat. Commun.10, 2025 (2019). - PMC - PubMed
    1. Ren, X. et al. Inhibition of glycolysis-driven immunosuppression with a nano-assembly enhances response to immune checkpoint blockade therapy in triple negative breast cancer. Nat. Commun.14, 7021 (2023). - PMC - PubMed
    1. Rong, X. et al. Sono-activable and biocatalytic 3D-printed scaffolds for intelligently sequential therapies in osteosarcoma eradication and defect regeneration. Nat. Commun.16, 6150 (2025). - PMC - PubMed
    1. Huang, Z. et al. Two-dimensional coordination risedronate-manganese nanobelts as adjuvant for cancer radiotherapy and immunotherapy. Nat. Commun.15, 8692 (2024). - PMC - PubMed

MeSH terms