Comparative Study
. 2025 Aug 16;15(1):29995.
doi: 10.1038/s41598-025-15761-8.

Multi-laboratory comparisons of manual patch clamp hERG data generated using standardized protocols and following ICH S7B Q&A 2.1 best practices

Affiliations
Comparative Study

Multi-laboratory comparisons of manual patch clamp hERG data generated using standardized protocols and following ICH S7B Q&A 2.1 best practices

Claudia Alvarez Baron et al. Sci Rep. .

Abstract

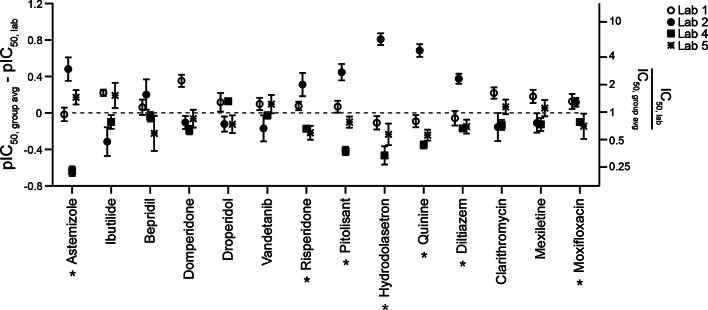
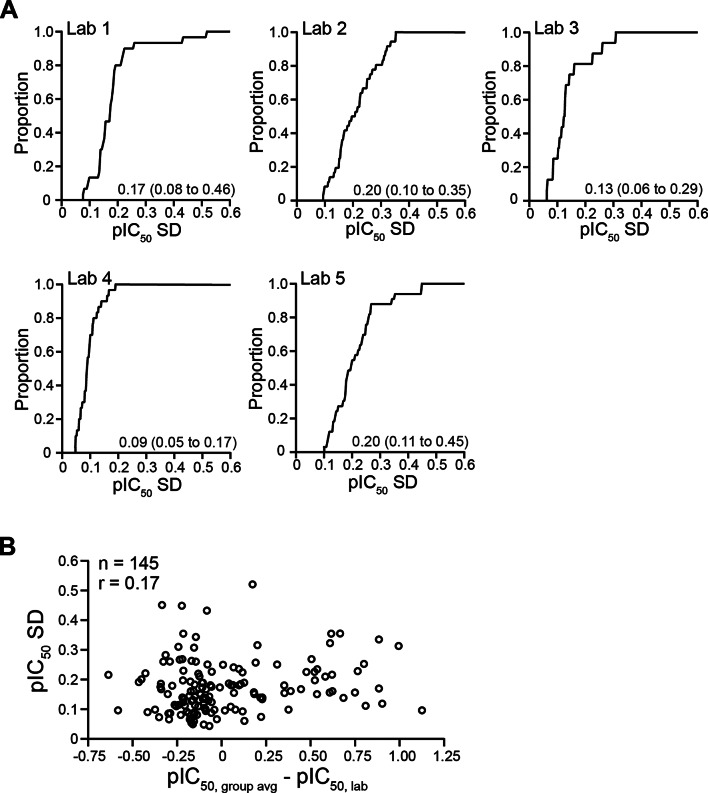
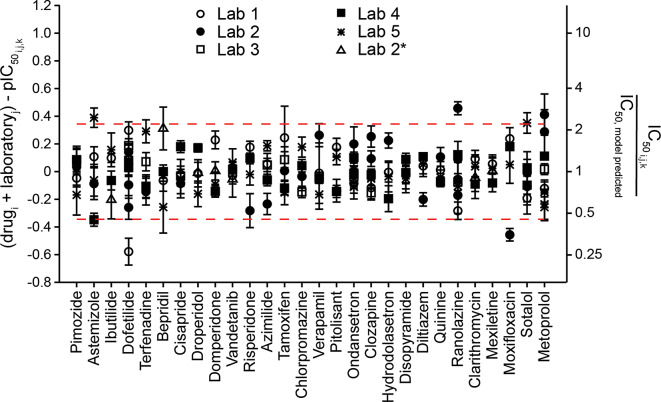
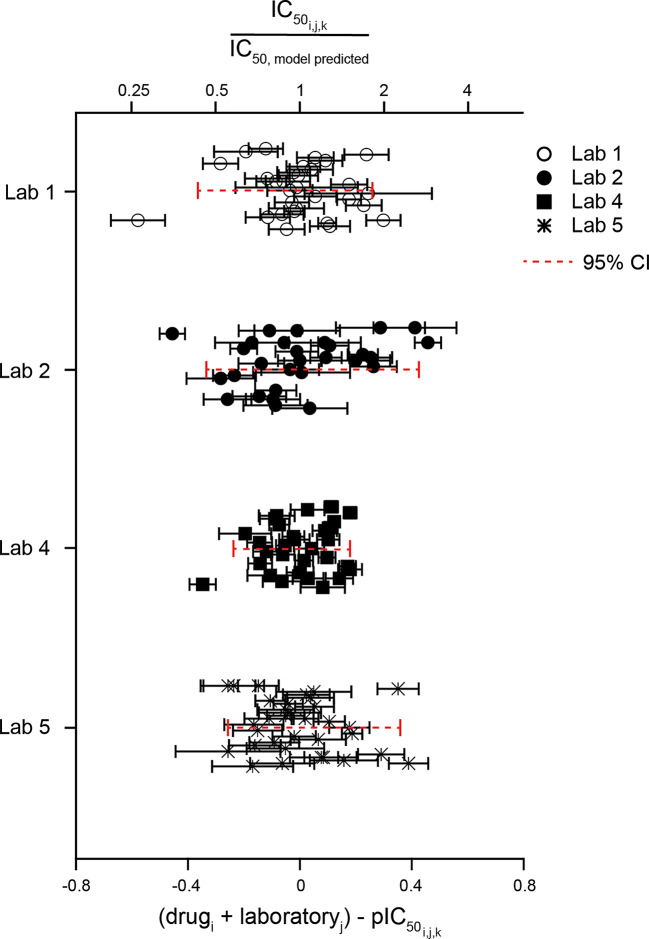
Acute block of hERG channels is the most common mechanism underlying drug-induced QTC prolongation and potentially fatal Torsade de Pointes arrhythmia. Updates to ICH E14 Q&As now allow for using negative nonclinical data, including hERG, to support QTC risk assessment in late-stage clinical development. To interpret the hERG results, understanding hERG assay reproducibility or hERG data variability is pivotal. Protocol and best practice recommendations have been provided with the goal of minimizing lab-to-lab data differences, but the impact remains unclear. To fill this knowledge gap, hERG data from a HESI-coordinated multi-laboratory study were leveraged. Using standardized protocol and following best practices for patch clamp studies, five laboratories tested 28 drugs using the manual patch clamp technique. Systematic differences in block potencies were observed for data generated by one laboratory for the first 21 drugs, and these differences disappeared for the last seven drugs. Exposure, pharmacological sensitivity of the cell lines, and cell/data qualities were ruled out as the factors underlying systematic differences. All laboratories retested two drugs and obtained results within 1.6X of the initial testings, except for another laboratory that obtained data for one drug that differed from its initial testing by 7.6X. Descriptive statistics and meta-analysis were applied to the dataset to estimate what the distribution in hERG block potencies would be if a laboratory were to test the same drug repeatedly. This measure, or hERG data variability, was ~ 5X. Based on these results, hERG block potency values within 5X of each other should not be considered different, since these values are within the natural data distribution of the hERG assay; laboratory-specific safety margin threshold may be required to account for systematic data differences.

Keywords: Assay reproducibility; Cardiac safety; Concentration-inhibition; Delayed ventricular repolarization; Experimental uncertainty; Safety margin.


Conflict of interest statement

Declarations. Competing interests: The authors declare no competing interests.

Figures

Fig. 1
Fig. 1
Across-laboratory data comparison for Phase 1 drugs. A plot of the average pIC50 value across five laboratories minus individual laboratory’s pIC50 for the studied drugs. The left Y-axis is equal to formula image. Error bars: ± 95% CI of pIC50. The right Y-axis shows the corresponding changes in multiples of IC50 or formula image. Drug potency estimations shown here and rest of the figures accounted for drug loss. The averaged differences in pIC50 to the group averages across all Phase 1 drugs are as follows (with 95% CI in parenthesis): Lab 1, −0.16 (−0.07 to −0.24); Lab 2, 0.65 (0.75 to 0.55); Lab 3, −0.15 (−0.10 to −0.20); Lab 4, −0.20 (−0.15 to −0.25), and Lab 5, −0.14 (−0.05 to −0.24). Lab 2 shows systematically higher pIC50s for all drugs irrespective of drug potencies.
Fig. 2
Fig. 2
Additional repeat experiments by Labs 2 and 5 to assess impact of drug delivery methods, cell line, and source of drugs/drug stocks on drug potencies. (A) Experiments conducted by Lab 2 to assess the impact of delivery method on the potency of ranolazine, clozapine, sotalol, and metoprolol. In the initial testing using the direct pipetting method (Fig. 1), Lab 2’s pIC50 differences to the group averages for these drugs were 1.05, 0.76, 0.53 and 0.88, respectively. In additional repeat experiments, drugs were applied using constant perfusion. Plots show the average pIC50 values across all experiments for the same drug minus pIC50s from individual experiments that tested different drug delivery methods. Error bars: ± 95% CI of pIC50 from individual experiments. The pIC50 differences to each drug averages are: ranolazine, 0.62; clozapine, 0.15; sotalol, 0.09, and metoprolol, 0.11, (B) this panel shows experiments conducted by Lab 5. The plot shows average pIC50 values across all metoprolol experiments minus pIC50 from individual experiments. (C) Summary of metoprolol results by Labs 2 and 5.
Fig. 3
Fig. 3
Repeat testings of ondansetron and dofetilide. Plots of averaged pIC50s from initial and repeat testings minus pIC50 from individual experiments for ondansetron (upper panel) and dofetilide (lower panel). Error bars: ± 95% CI of pIC50. The right Y-axes show the corresponding changes in multiples relative to the average of both experiments, or (formula image).
Fig. 4
Fig. 4
Across-laboratory data comparison for Phase 2 drugs. Same layout as Fig. 1. The averaged pIC50 differences to the group averages are as follows: Lab 1, 0.09 (0.02 to 0.16); Lab 4, −0.20 (−0.30 to −0.09), and Lab 5, −0.07 (−0.15 to 0.01). For Lab 2, the averaged pIC50 difference to the group averages is 0.46 (0.29 to 0.63) for the first seven drugs tested indicated by an asterisk (*) (astemizole, risperidone, pitolisant, hydrodolasetron, quinine, diltiazem, and moxifloxacin). The systematic differences resolved for the last seven drugs tested by Lab 2 (ibutilide, bepridil, domperidone, droperidol, vandetanib, clarithromycin and mexiletine). The averaged pIC50 differences to the group averages for these drugs is −0.11 (-−0.23 to 0.004) for Lab 2.
Fig. 5
Fig. 5
Percent drug loss increases with LogP. Information regarding Phase 1 drugs are shown in black; Phase 2 drugs, red. (A) A table of drugs in this study and their respective LogP values. (BF) show plots of averaged percent drug loss versus LogP for individual laboratories. A sigmoidal function in the form of formula image, with minimum and maximum constrained to 0 and 100, respectively, was fitted to the datapoints in the percent drug loss versus LogP plots to yield the LogP at which 50% of the drug is lost (x50) and the slope of the relationship (dx). The solid gray line shows the fit; the dotted gray lines indicate the upper and lower 95% CI. The coefficient values ± 95% CI are shown in each plot.
Fig. 6
Fig. 6
hERG current stability in vehicle control solution and following drug solution application. Histogram plots include all drugs in the study for Phase 1 (black) and Phase 2 (red). The X-axes show number of control traces (left column) or hERG current stability (middle and right columns). Stability in the vehicle (control) and drug solutions were estimated as the percent change between the hERG current amplitudes for the first and fifth trace (20 s apart) of the last five traces recorded in the vehicle or drug solutions, respectively. Labels show mean ± SE of all values. For the histograms illustrating the number of control traces recorded in the control solution and hERG current stability in the control condition, the Y-axes reflect cell count, and the “n” label indicates the total number of cells recorded by each laboratory. For the histograms illustrating the stability of the inhibition achieved following drug application, the Y-axes reflect the number of drug applications, and the “n” label the total number of drug applications. Labs 1, 4, and 5 applied one to two drug concentrations per cell. Labs 2 and 3 applied one concentration per cell.
Fig. 7
Fig. 7
Within-experiment variability. (A) Cumulative distribution plots of the SD of pIC50s for all experiments, including the initial testings, blind repeat testings, and additional repeat experiments if any, by individual laboratories. For Labs 1 and 4, this amounts to 30 individual studies (28 drugs from initial testing and two drugs from blind repeat testings). For Lab 2, 36 individual studies were included (28 drugs from initial testing, two drugs from blind repeat testings, three additional ranolazine studies, and one additional study each for metoprolol, clozapine, and sotalol). For lab 3, 16 individual studies were done (14 drugs from initial testing, two drugs from blind repeat testings). For Lab 5, 33 studies were included (28 drugs from initial testing, two drugs from blind repeat testings, two additional metoprolol studies, and one additional astemizole study). Text labels in the plots show median (2.5th percentile, 97.5th percentile) of the SD of pIC50s. (B) pIC50 SD versus formula image. A total of 145 experiments were conducted in this study and used in this analysis. r is the linear correlation coefficient.
Fig. 8
Fig. 8
Descriptive statistics approach to estimating variability in hERG block potency. (A) Drugs shown in descending order of potencies. (B) To remove drug-specific effects, the average pIC50s for each drug (formula image) for all available data including repeat testings and additional repeat experiments (red diamonds) were subtracted from each individual pIC50 (formula image). This is equal to formula image as shown in Figs. 1 and 4. After this subtraction step, laboratory-specific tendencies were estimated by averaging the formula image values for each lab. These averaged values are depicted here as horizontal lines for each lab. Lab 2 data for the last seven drugs studied (ibutilide, vandetanib, bepridil, clarithromycin, domperidone, droperidol, and mexiletine) were averaged separately (Lab 2*). The right Y-axis shows the equivalent changes in linear scale. (C) The laboratory-specific tendencies are removed, leading to center alignment of each laboratory’s remaining, unexplained values for each drug. (D) Histogram of the remaining, unexplained values shown in (C) to visualize normal distribution of the data (N = 145 studies). Dashed red lines are the 2.5th and 97.5th percentiles of the data (95% CI).
Fig. 9
Fig. 9
Modelling approach to estimating variability in hERG block potency. Plot of the variability between studies not explained by differences in drug potency and laboratory for all drugs, estimated using a mixed effects meta-analysis model. The left Y-axis shows the observed pIC50 for each drug from each laboratory (formula image) subtracted from the model-predicted pIC50 accounting for drug and laboratory effects (formula image. The right Y-axis shows the equivalent changes in multiples relative to the model-predicted IC50. Dashed red lines represent the 95% CI.
Fig. 10
Fig. 10
Laboratory-specific variability estimated using the location-scale meta-analysis model. Plot of variability in hERG block potencies for each laboratory that participated in Phase 1 and Phase 2. For Lab 2, only Phase 1 drugs and the first seven drugs studied during Phase 2 are included. The bottom X-axis shows the pIC50 for each drug from each laboratory (formula image) subtracted from the model-predicted pIC50 accounting for drug and laboratory effects (formula image. The top X-axis shows the equivalent changes in multiples relative to the model-predicted IC50. Model estimations included all laboratories and drugs in the study and any repeats by each Lab. Dashed red lines represent the 95% CI.

Similar articles

References

    1. Anonymous ICH S7B: the non-clinical evaluation of the potential for delayed ventricular repolarization (QT interval prolongation) by human pharmaceuticals. The international Council for harmonisation of technical requirements for pharmaceuticals for human use (ICH). (2005). https://database.ich.org/sites/default/files/S7B_Guideline.pdf.
    1. Anonymous & ICH E14. : The clinical evaluation of qt/qtc interval prolongation and proarrhythmic potential for nonantiarrhythmic drugs. The international Council for harmonisation of technical requirements for pharmaceuticals for human use (ICH). (2005). https://database.ich.org/sites/default/files/E14_Guideline.pdf.
    1. Anonymous & ICH E14/S7B IWG. : Questions and answers: clinical and nonclinical evaluation of qt/qtc interval prolongation and proarrhythmic potential.the international Council for harmonisation of technical requirements for pharmaceuticals for human use (ICH). (2022). https://database.ich.org/sites/default/files/ICH_E14-S7B_QAs_Step2_2020_....
    1. Kirsch, G. E. et al. Variability in the measurement of hERG potassium channel inhibition: effects of temperature and stimulus pattern. J. Pharmacol. Toxicol. Methods. 50, 93–101. 10.1016/j.vascn.2004.06.003 (2004). - PubMed
    1. Guo, J., Zhan, S., Lees-Miller, J. P., Teng, G. & Duff, H. J. Exaggerated block of hERG (KCNH2) and prolongation of action potential duration by erythromycin at temperatures between 37 degrees C and 42 degrees C. Heart Rhythm. 2, 860–866. 10.1016/j.hrthm.2005.04.029 (2005). - PubMed

Publication types

MeSH terms

Substances

LinkOut - more resources