. 2025 Aug 16;8(1):1236.
doi: 10.1038/s42003-025-08693-6.

Coordination of virulence factors and lifestyle transition in Pseudomonas aeruginosa through single-cell analysis

Affiliations

Coordination of virulence factors and lifestyle transition in Pseudomonas aeruginosa through single-cell analysis

Haozhe Chen et al. Commun Biol. .

Abstract

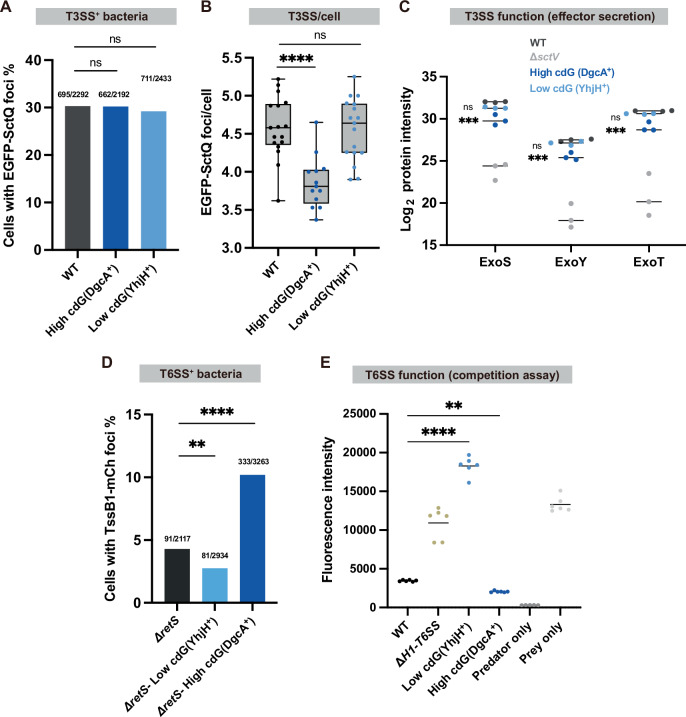
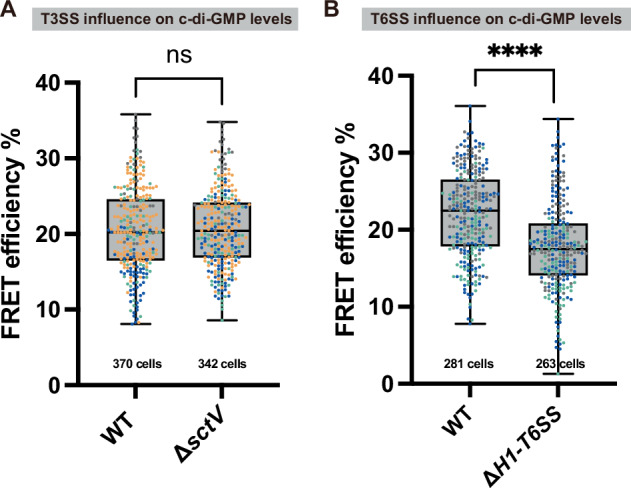
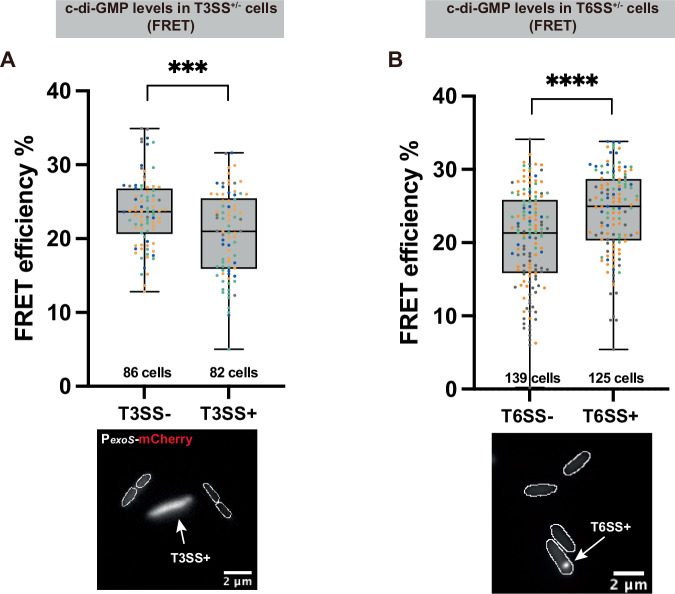
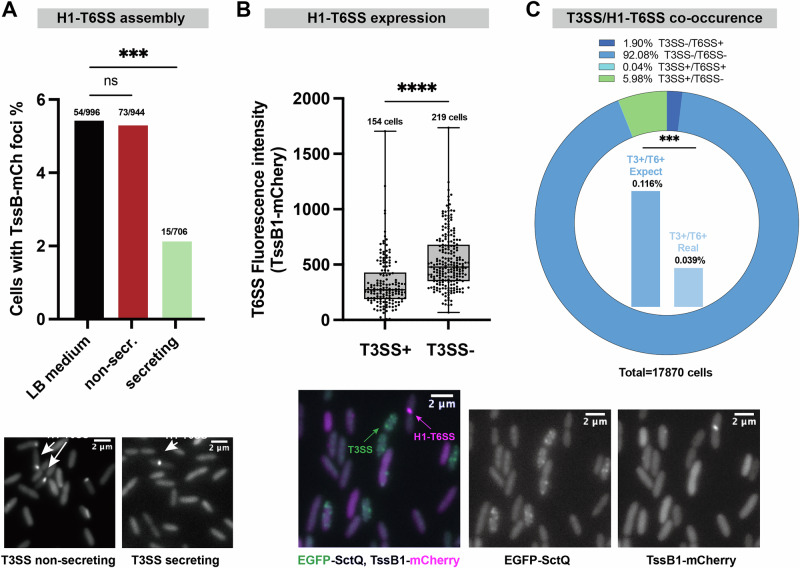
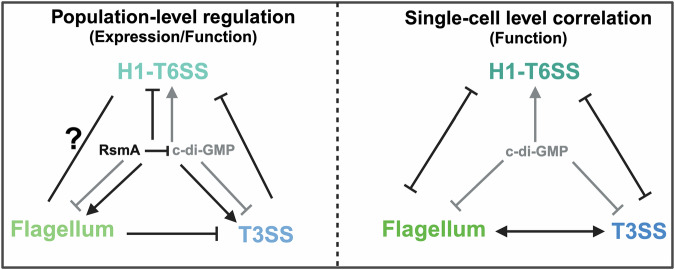
Pseudomonas aeruginosa, a versatile Gram-negative opportunistic pathogen, relies on multiple virulence mechanisms, including a Type III Secretion System (T3SS) and several Type VI Secretion Systems (T6SS), to establish infections. The bacterial universal second messenger cyclic di-guanylate (c-di-GMP) orchestrates the lifestyle transitions of Pseudomonas aeruginosa between motile and biofilm-associated states and influences the expression of virulence traits. While it is clear that these systems are interconnected, their precise interaction on the single-cell level has remained unclear. In this study, we use single-cell analysis to dissect the role of c-di-GMP in the heterogeneity of virulence factors in P. aeruginosa populations. Our results confirm earlier findings that on the population level, high c-di-GMP levels lead to increased formation and activity of the H1-T6SS, while negatively influencing formation and activity of the T3SS. On the single-cell level, we further characterize the virulence crosstalk within P. aeruginosa populations by presenting a cooperative relationship among T3SS and flagellum and antagonistic relationships between presence of the H1-T6SS and the T3SS as well as the flagellum. Overall, this c-di-GMP-orchestrated heterogeneity and crosstalk of virulence systems suggest a strategy to optimize survival and pathogenicity under varying environmental conditions in the framework of the motile-sessile lifestyle transition.


Conflict of interest statement

Competing interests: The authors declare no competing interests.

Figures

Fig. 1
Fig. 1. Increased cyclic-di-GMP levels downregulate T3SS assembly and activity, and upregulate H1-T6SS assembly and activity.
A Fraction of T3SS-positive bacteria in different c-di-GMP backgrounds. Data is shown as a fraction of cells with EGFP-SctQ foci; exact numbers are shown above each bar. Samples were taken from >10 different fields of view in 3 different experiments. Statistical analysis was done via χ2 test, ns, non-significant (the precise numbers of all p-values are provided in Suppl. Data 1). B Number of T3SS per bacterium in different c-di-GMP backgrounds. Data is shown as the number of EGFP-SctQ foci per T3SS-positive cell, with each data point representing the calculation from one field of view. Samples were taken from >10 different fields within 3 different experiments. Statistical analysis was done via ANOVA with multiple comparisons to WT, ****, p < 0.0001; ns, non-significant. C T3SS effector secretion in different c-di-GMP backgrounds examined by label-free quantitative mass spectrometry. ExoS/Y/T are the three T3SS effectors in PAO1; protein intensities (reflecting the abundance of a specific protein in a sample) in the supernatant are compared in different c-di-GMP backgrounds. Data is shown as log2 mean intensity of effector proteins for the different background strains. Bars indicate the mean value. Biological replicates, n = 3. Statistical analysis was done via ANOVA with multiple comparisons to WT, ***, p < 0.001; ns, non-significant. D Fraction of H1-T6SS-positive bacteria in different c-di-GMP backgrounds. Data is shown as a fraction of cells with H1-T6SS assembly (TssB1-mCherry foci); exact numbers are shown above each bar. Samples were taken from >10 different fields of view in 3 different experiments. Statistical analysis was done via χ2 test, **, p < 0.01; ****, p < 0.0001. E H1-T6SS killing efficiency test in different c-di-GMP backgrounds. Indicated strains were used as predators, while a YFP-labeled H1-T6SS effector-immunity pair deletion strain (Δtse6tsi6) was used as prey. Data is shown as background-corrected prey fluorescence. Data points are shown as an endpoint value of a 24-h killing assay. Biological replicates, n = 3. Statistical analysis was done via ANOVA with multiple comparisons to WT, **, p < 0.01; ****, p < 0.0001.
Fig. 2
Fig. 2. Presence of the H1-T6SS, but not T3SS, leads to increased c-di-GMP levels.
A FRET measurement of c-di-GMP between a T3SS-deficient strain (ΔsctV) and WT. Data is shown as corrected FRET efficiency, a positively correlated indicator of c-di-GMP levels, see Suppl. Fig. 1. Detailed calculations see Methods. Each data point represents a measurement of a single cell. Experiments were repeated on multiple dates, with each color set representing data points from one day. Highest and lowest end of each bar represent maximum and minimum value, respectively; boxes indicate median and 25th–75th percentile. The total cells tested for each group is indicated under the respective bars. B FRET measurement of c-di-GMP between a H1-T6SS deletion strain (ΔH1-T6SS) and WT. Graph explanation is the same as above. Statistical analysis was done via Student’s t-test; ns, non-significant; ****, p < 0.0001.
Fig. 3
Fig. 3. C-di-GMP levels are negatively correlated with T3SS activity and positively correlated with H1-T6SS activity on the single-cell level.
A FRET measurement of c-di-GMP in T3SS-negative and -positive populations (T3SS-, T3SS+). Data is shown as corrected FRET efficiency as in Fig. 2, detailed calculations, see “Methods”. The microscopy image below with merged fluorescence channels illustrates the classification of T3SS-positive cells by fluorescence of the PexoS-mCherry reporter for T3SS activity. B FRET measurement of c-di-GMP in T6SS-negative and -positive populations (T6SS-, T6SS + ). The microscopy image below indicates the classification of T6SS-positive cells by the presence of TssB1-mCherry structures. Cell outlines are indicated by white lines. In both graphs, each data point represents a measurement of a single cell. Experiments were repeated on multiple dates, with each color set representing data points from one day. Highest and lowest end of each bar represent maximum and minimum value, respectively; boxes indicate median and 25th–75th percentile. The number of cells tested for each group is indicated below. See Suppl. Fig. 9 for larger fields of view. Statistical analysis by Student’s t -test, ***, p < 0.001; ****, p < 0.0001.
Fig. 4
Fig. 4. T3SS and H1-T6SS show antagonistic behavior on the single-cell level.
A Microscopy analysis of H1-T6SS assembly in LB, non-secreting (LB + 5 mM CaCl2) and secreting medium (LB + 5 mM EGTA, see Methods for details). Data is shown as a fraction of T6SS-positive bacteria (presence of TssB1-mCherry foci), with exact numbers shown above each bar. Samples were taken from >10 different fields in 3 different experiments. Statistical analysis was done via Student’s t-test, ***, p < 0.001; ns, non-significant. B Microscopy analysis T6SS expression levels in EGFP-SctQ TssB1-mCherry ΔsctW ΔretS bacteria with or without T3SS assembly. Data is shown as background-subtracted and normalized TssB1-mCherry overall fluorescence intensity. Each data point represents the background-corrected TssB1-mCherry overall fluorescence intensity from one cell. Samples were taken from >10 different fields of view from 3 different experiments. Highest and lowest end of each bar represent maximum and minimum value, respectively; boxes indicate median and 25th–75th percentile. Statistical analysis was done via Student’s t-test, ****, p < 0.0001. Microscopy images below show an overlay of the T3SS channel (green) and the H1-T6SS signal (red), as well as the individual channels (left, green; right, red). C Quantification of co-occurrence of T3SS and H1-T6SS in EGFP-SctQ, TssB1-mCherry, ΔretS, ΔsctW cultured in LB medium. Data is shown as a fraction of bacteria with the indicated presence or absence of the T3SS and T6SS, as evaluated by the presence of EGFP-SctQ and TssB1-mCherry foci; the exact fraction for each group is shown at the top, and the total number of cells tested is indicated at the bottom. Inner histograms show the actual ratio of cells with both T3SS and H1-T6SS, and its comparison to the theoretical ratio based on the individual fractions, assuming no correlation. Samples were taken from >50 different fields in 8 different experiments. Statistical analysis was done via χ2 test, ***, p < 0.001.
Fig. 5
Fig. 5. Presence of flagella positively correlates with presence of the T3SS, but negatively with H1-T6SS presence and c-di-GMP distribution.
A FRET measurement of c-di-GMP within flagellum on/off populations. Data is shown as corrected FRET efficiency as in Fig. 2, detailed calculations, see “Methods”. Each data point represents a measurement of a single cell. Experiments were repeated on multiple dates, with each color set representing data points from one day. Highest and lowest end of each bar represent maximum and minimum value, respectively; boxes indicate median and 25th–75th percentile. The total cells tested for each group is labeled under the respective bars. Statistical analysis was done via Student’s t -test, ****, p < 0.0001. The microscopy image below indicates flagellum fluorescence label at the cell terminal. Cell outlines are labeled. B Quantification of co-existence of T3SS and flagellum (presence of EGFP-SctQ and FliM-mCherry foci, respectively, bacteria cultured in T3SS-secreting medium). Data is shown as a ratio of cells with indicated status (flagellum on/off and T3SS on/off) to total cells the exact ratio for each group is shown at the top, and the total cell amount tested is marked at the bottom. Inner histograms show the actual ratio of cells with both T3SS and flagellum, and its comparison to the theoretical ratio based on the individual fractions. Representative microscopy image below. Samples were taken from >30 different fields and in 3 different experiments. Statistical analysis was done via χ2 test, ****, p < 0.0001. C Quantification of co-existence of H1-T6SS and flagellum (presence of TssB1-Ypet and FliM-mCherry foci, respectively, in a ΔretS background, bacteria cultured in LB medium). Graph structure as in (B). Representative microscopy image below. Samples were taken from >30 different fields and in 5 different experiments. See Suppl. Fig. 9 for larger fields of view. Statistical analysis was done via χ2 test, ****, p < 0.0001.
Fig. 6
Fig. 6. Virulence systems crosstalk in P. aeruginosa.
This study focused on H1-T6SS, T3SS and flagellum in P. aeruginosa. The population level evidence (left) shows that flagellum existence inhibits T3SS operon transcriptional level, and T3SS secretion represses H1-T6SS secretion. The exact relationship between flagellum and H1-T6SS remains unknown. RsmA and c-di-GMP were shown to coordinate the transition among different virulence systems. RsmA decreases c-di-GMP. RsmA (black) promotes flagellum and T3SS expression yet blocks H1-T6SS expression ,. C-di-GMP (gray) functions in an entirely opposite way to RsmA. The single-cell level evidence (right) shows that flagellum and T3SS function cooperatively in P. aeruginosa, while H1-T6SS function is negatively associated with flagellum and T3SS. C-di-GMP is involved in the virulence crosstalk by its positive association with H1-T6SS functional bistability and negative association with T3SS and flagellum functional bistability. Created in BioRender. Chen H. (2025) https://BioRender.com/58n8ik2.

Similar articles

References

    1. Fernández-Barat, L. et al. Intensive care unit-acquired pneumonia due to Pseudomonas aeruginosa with and without multidrug resistance. J. Infect.74, 142–152 (2017). - PubMed
    1. Rossi, E. et al. Pseudomonas aeruginosa adaptation and evolution in patients with cystic fibrosis. Nat. Rev. Microbiol.19, 331–342 (2021). - PubMed
    1. Wood, S. J., Kuzel, T. M. & Shafikhani, S. H. Pseudomonas aeruginosa: infections, animal modeling, and therapeutics. Cells12, 199 (2023). - PMC - PubMed
    1. Lorusso, A. B., Carrara, J. A., Barroso, C. D. N., Tuon, F. F. & Faoro, H. Role of efflux pumps on antimicrobial resistance in Pseudomonas aeruginosa. Int. J. Mol. Sci.23, 15779 (2022). - PMC - PubMed
    1. Organization, W. H. WHO Bacterial Priority Pathogens List, 2024: Bacterial Pathogens of Public Health Importance, to Guide Research, Development and Strategies to Prevent and Control Antimicrobial Resistance. (World Health Organization, 2024).

MeSH terms

LinkOut - more resources