. 2025 Aug 18;10(1):257.
doi: 10.1038/s41392-025-02347-z.

NADPH oxidase 1/4 dual inhibition impairs transforming growth factor-beta protumorigenic effects in cholangiocarcinoma cancer-associated fibroblasts

Affiliations

NADPH oxidase 1/4 dual inhibition impairs transforming growth factor-beta protumorigenic effects in cholangiocarcinoma cancer-associated fibroblasts

Josep Amengual et al. Signal Transduct Target Ther. .

Abstract

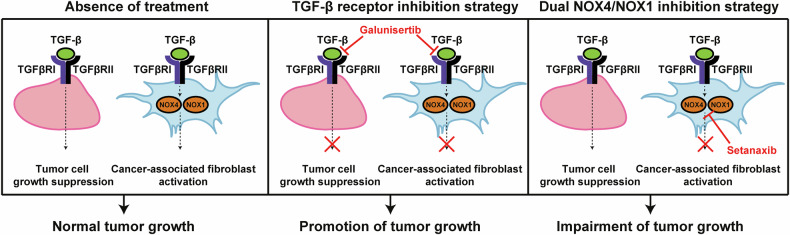
Transforming growth factor beta (TGF-β) signalling has become an attractive therapeutic target due to its pro-tumorigenic actions on epithelial cells and its immunosuppressive effects in the tumour microenvironment. In intrahepatic cholangiocarcinoma (iCCA), a highly aggressive malignancy of the biliary tract with poor prognosis, the latest clinical trials using TGF-β inhibitors have failed indicating that the specific actions carried out by TGF-β in iCCA are yet not well delineated. Here, we show that TGF-β signalling is highly active in iCCA and exerts a prominent suppressor effect on tumour cell lines and organoids established from iCCA metastases biopsies, that relies on a functional canonical SMAD2/3/4 signalling. Thus, TGF-β inhibitors promote, instead of inhibiting, tumour cell growth. In this context, a promising strategy is to target intracellular proteins downstream the TGF-β receptors accounting only for TGF-β pro-tumorigenic actions. NADPH oxidase 4 (NOX4), a downstream mediator of the TGF-β signalling pathway, is strictly expressed in cancer-associated fibroblasts (CAF) of iCCA and acts in concert with NOX1 to regulate CAF functions. Use of a dual NOX4/NOX1 inhibitor impaired CAF actions and reduced tumour growth in vitro and in two different in vivo iCCA experimental models. Collectively, our findings reveal an actionable way to specifically target TGF-β pro-tumorigenic actions in CAF from iCCA without undesirable side effects on tumour cells, suggesting a potentially bright future for dual NOX4/NOX1 inhibitors in the clinics, alone or in combination with other therapies.


Conflict of interest statement

Competing interests: T.V.T. received research grants from AstraZeneca, Lilly Oncology, Servier, Alentis, and Incyte, which are irrelevant to the current study. Personal fee from AstraZeneca and Incyte. Remaining authors have no conflicts of interest to declare related to this manuscript.

Figures

Fig. 1
Fig. 1
TGF-β signalling is activated and functional in human and mouse intrahepatic cholangiocarcinoma (iCCA) tumours. a, b TGF-β ligands (TGFB) and receptors (TGFBR) mRNA expression in CCA tumours compared to surrounding liver tissue from the IDIBELL (n = 17), the TCGA (n = 36) and TIGER-LC (n = 91) cohorts of patients (a) and from the SB1 syngeneic orthotopic (n = 9) and the AKT-YAP (n = 7) and AKT-NICD hydrodynamic tail vein injection iCCA tumour models (b). c Representative immunohistochemical images showing phophoSMAD2 expression, used as a readout of the activation of the TGF-β signalling pathway, in samples from iCCA patients, and SB1, AKT-YAP and AKT-NICD iCCA animal models. Scale: 100 µm. d Kaplan-Meier curve of 5-year overall survival of patients from GSE244807 cohort (n = 246) stratified based on TGFBR1 and TGFBR2 expression (Cox Proportional Hazards model). e Mutational status of different members of the TGF-β canonical signalling pathway in iCCA patients. mRNA expression levels were determined by RT-qPCR in samples from the IDIBELL cohort of patients and the animal models. Gene expression data from public data bases was obtained using RNAseq (TCGA cohort) or microarrays (TIGER cohort). Values are expressed as means ± SEM. *p < 0.05; **p < 0.01, ***p < 0.001, ****p < 0.0001 as compared to NT. NT non-tumoral, T tumour
Fig. 2
Fig. 2
TGF-β1 effects on intrahepatic cholangiocarcinoma (iCCA) cell lines. a Cell viability of iCCA cell lines after exposure to TGF-β1 (2 ng/ml) for 72 h, as determined by cell counting. b Representative images showing the morphology of the iCCA cell lines at the time of cell viability determination. Scale: 250 µm. c Representative images of Western blot analysis of phosphorylation and total expression of SMAD2, SMAD3, STAT3, AKT and ERK1/2 in iCCA cell lines exposed to TGF-β1 (2 ng/ml) for the indicated times. d Representative images of Western blot analysis showing the basal protein expression of SMAD2, SMAD3, SMAD4 and SMAD7 in iCCA cell lines. e Summary of responses in a panel of 7 iCCA cell lines to TGF-β1 exposure based on the results displayed in panels a-d. Values are expressed as means ± SEM from at least 3 cultures. **p < 0.01, ***p < 0.001 as compared to the vehicle
Fig. 3
Fig. 3
TGF-β receptor inhibition promotes intrahepatic cholangiocarcinoma (iCCA) tumour cell growth by inhibiting SMAD canonical signalling. a Western blot images showing SMAD2 phosphorylation in HuCCT1 and RBE cells treated with TGF-β1 (2 ng/ml), TGF-β1 receptor I inhibitor galunisertib (10 µM) or both, for 1 h. b Number of colonies of HuCCT1 and RBE cells after 7-10 days of treatment with TGF-β1 (2 ng/ml), galunisertib (10 µM) or both. Representative images of colonies are shown c Size of spheres from HuCCT1 and RBE cells after 4 days of treatment with TGF-β1, galunisertib (10 µM) or both. Representative images of spheres at the time of size analysis are shown. Scale: 100 µm. d, e RNA-seq analyses conducted in HuCCT1 and RBE cells treated with TGF-β1 (2 ng/ml) or TGF-β1 receptor I inhibitor galunisertib (10 µM). Heatmap (d) showing changes in the expression of different genes in the iCCA cell lines in response to TGF-β1 or galunisertib. Dot plot (e) showing differences in enrichment for key events related with “ECM (extracellular matrix) and migration” and “Cell cycle and proliferation” in iCCA cells. f Dose-response curves of TGF-β1 and galunisertib for PDXO153 organoids derived from CCA_PDXs (PDXO). Cell viability was determined using a Cell Titer-Glo assay 4 days after the treatment initiation. Representative images of Western blot analysis of phosphoSMAD3 and total SMAD3 in PDX153 organoids after treatment with TGF-β1 (2 ng/ml) or galunisertib (10 µM) for 4 days are shown. g Representative immunohistochemical images showing human panCK (labelling human iCCA tumour cells), murine vimentin (labelling stromal murine cells) and Ki67 (as a marker of cell proliferation) in PDXO153 organoids after the same treatment than in f. Scale: 200 µm. Values are expressed as means ± SEM from at least 3 cultures. **p < 0.01, ***p < 0.001, as compared to the vehicle. V vehicle, T TGF-β1, G galunisertib
Fig. 4
Fig. 4
NOX4 is overexpressed in intrahepatic cholangiocarcinoma (iCCA) and specifically expressed in cancer-associated fibroblasts (CAF). a NOX4 mRNA expression in CCA tumours compared to surrounding liver tissue (NTL) from the IDIBELL (n = 17), the TCGA (n = 36) and TIGER-LC (n = 91) cohorts of patients. b Dot plot showing NOX4 expression in cell types and cancer-associated fibroblasts (CAF) subtypes (apCAF antigen-presenting CAF, iCAF inflammatory CAF, myCAF myofibroblast CAF vCAF vascular CAF) from scRNAseq data set GSE201425 from CCA biopsies. c Representative immunohistochemistry images from human iCCA showing tumour architecture (hematoxylin-eosin, H&E), tumour cells (CK19), extracellular matrix (Picro Sirius Red) produced by CAF (α-SMA), and NOX4 localization. Scale: 200 µm (100 µm in magnification pictures). d NOX4 mRNA expression in non-tumoral (NT) or tumoral (T) stromal samples from the Rennes microdissection cohort. e Correlation between ACTA2 and COL1A1 with NOX4 expression in microdissected stroma from 10 iCCA samples. f NOX4 mRNA and α-SMA protein basal expression in LX2-HSC, hTERT-HSC, HSC-GFP cells and CAF, as determined by RT-QPCR and Western blot, respectively. g, h NOX4 mRNA expression in LX2-HSC, hTERT-HSC and HSC-GFP cells (g) and CAF (h) after exposure to TGF-β1 (2 ng/ml) for the indicated times. Values are expressed as fold change versus vehicle (3 h time point in g) and represented as means ± SEM from at least 3 cultures. i, j Representative images of Western blot analysis of Collagen 1 (COL1), α-SMA and NOX4 protein expression in LX2-HSC, hTERT-HSC and HSC-GFP cells (i) and CAF (j) after exposure to TGF-β1 (2 ng/ml) for the indicated times. mRNA expression levels were determined by RT-qPCR in samples from the IDIBELL cohort of patients. Gene expression data from public data bases was obtained using RNAseq (TCGA cohort) or microarrays (TIGER cohort). *p < 0.05, **p < 0.01, ***p < 0.001, ****p < 0.0001; as compared to NTL or the vehicle. Correlations were determined using Spearman’s correlation analysis
Fig. 5
Fig. 5
NOX4 and NOX1 act in concert to allow TGF-β-induced fibroblast transdifferentiation. Analyses were conducted on the syngeneic SB1 orthotopic iCCA tumours in WT and NOX4-/- mice (n = 6), established as illustrated in Supplementary Fig. 18. a Representative macroscopic images of the tumours at term and tissue sections stained with hematoxylin-eosin (H&E), to illustrate the size of the tumours, α-SMA to visualize cancer-associated fibroblasts (CAF) and Picro Sirius Red to visualize collagen deposition. Scale (H&E): 2.5 mm. Scale (α-SMA and Picro Sirius Red): 250 µm. b α-SMA and Picro Sirius Red positive area was quantified using ImageJ. c, d mRNA (c) and protein (d) expression of NOX4, ACTA2 (α-SMA) and COL1A1 (Collagen 1, COL1) after TGF-β1 treatment for 48 h in the hTERT-HSC CRISPR-Control and CRISPR-NOX4 cells, determined by RT-qPCR and Western blot. e H2O2 production was measured by Amplex red in CRISPR-Control and CRISPR-NOX4 cells after TGF-β1 treatment for 24 h and expressed as the amount of H2O2 normalized by mg of protein per hour. f Protein expression of α-SMA and COL1A1 and H2O2 production (as determined in d, e) in CRISPR-NOX4 cells treated with TGF-β1 in absence or presence of the NADPH oxidase inhibitor DPI (2.5 µM). g mRNA and protein expression of CYBA (p22phox) and NOX1 after TGF-β1 treatment for 48 h in the CRISPR-NOX4 and CRISPR-control cells, determined by RT-QPCR and Western blot respectively. h Protein expression of NOX1, α-SMA and COL1A1 and H2O2 production (as determined in d, e) in CRISPR-NOX4 cells treated with TGF-β1 and transfected with siRNA against NOX1 or the scrambled version (siControl). i Protein expression of α-SMA, COL1, NOX4 and NOX1 in hTERT-HSC WT cells transfected with siRNA against NOX4, NOX1 or both, and treated with TGF-β1. j Immunohistochemical analysis of NOX4 and NOX1 localization in serial tissue sections from human iCCA samples (IDIBELL cohort) (representative images). Scale: 200 µm. K Kaplan-Meier curve of 5-year overall survival of patients from GSE244807 cohort (n = 246) stratified based on NOX4 and NOX1 expression (Cox Proportional Hazards model). mRNA expression levels are expressed as fold change versus vehicle. Values are expressed as means ± SEM from at least 3 cultures. *p < 0.05; **p < 0.01
Fig. 6
Fig. 6
Dual NOX4/NOX1 inhibition impairs TGF-β-induced fibroblast transdifferentiation and cancer-associated fibroblasts (CAF) functions. a Representative images of Western blot analysis of Collagen 1 (COL1) and α-SMA in hepatic stellate cell (HSC) lines treated with TGF-β1 or the vehicle in absence or presence of setanaxib (left) or galunisertib (right) for 48 hours. b Dot plot showing differences in enrichment for key events related with signalling pathways involved in myofibroblast transdifferentiation in HSC lines treated with setanaxib or galunisertib. c Size of mixed spheres from HuCCT1 or RBE cells tagged with mCherry in combination with HSC-GFP after 4 days of treatment with setanaxib or galunisertib. Representative phase contrast images of spheres at the time of size analysis are shown. Also, fluorescence microscopy images of mCherry and GFP intensity are shown. Scale: 100 µm. d Representative images of Western blot analysis of COL1 and α-SMA in CAF treated with TGF-β1 (2 ng/ml) or the vehicle in absence or presence of setanaxib (40 µM) for 48 hours. e Size of spheres from HuCCT1 (marked in green with FITC) alone or in combination with CAF (marked in red with TRITC) after 1, 4 or 7 days of treatment with setanaxib or the vehicle. Representative phase contrast and images of spheres at the time of size analysis are shown. Also, fluorescence microscopy images of FITC and TRITC are shown. Scale: 50 µm. Values are expressed as means ± SEM from at least 3 cultures. *p < 0.05, **p < 0.01; ***p < 0.001; as compared with the vehicle
Fig. 7
Fig. 7
Therapeutic effect of dual NOX4/NOX1 inhibition with setanaxib on tumour progression in an intrahepatic cholangiocarcinoma (iCCA) PDX model. Tumour fragments from a previously characterized PDX (PDX153) were subcutaneously reimplanted into 6-week-old female NOD.CB-17-Prkdc scid/Rj. Once tumours reached an approximate volume of 150 mm3, mice started to be treated with galunisertib (150 mg/kg) or setanaxib (60 mg/kg). a Tumour growth was evaluated over 21 days in mice receiving vehicle, setanaxib or galunisertib (n = 6-7 animals per group). b Animals body weight was monitored through the experimental procedure time span to rule out potential toxic effects of any of the drugs. c, d Representative images of hematoxylin-eosin (H&E) and immunohistochemistry for Ki67 and cleaved-Caspase 3 (cCap3) (c). Immunohistochemistry for α-SMA and Picro Sirius Red (d). Scale: 100 µm. Quantification of Ki67, cCasp3 and Picro Red Sirius positive areas are shown below. Values are expressed as means ± SEM. *p < 0.05; **p < 0.01; ***p < 0.001; as compared with untreated mice
Fig. 8
Fig. 8
Dual NOX4/NOX1 inhibition with setanaxib reduces tumour burden in vivo in the AKT/YAP mouse intrahepatic cholangiocarcinoma (iCCA) model. iCCA tumours were induced using the HTVI AKT-YAP model and treated with galunisertib (150 mg/kg) or setanaxib (60 mg/kg) as illustrated in Supplementary Fig. 31a. a Representative macroscopic images of livers and Cytokeratin-19 (CK19) immunohistochemistry (to mark CCA cells) from animals treated with galunisertib or the vehicle. Scale: 1 mm. b Quantification of number of nodules/area and maximal tumour size in livers from a. ce Representative images (left) of hematoxylin-eosin (H&E) and IHCs for Ki67 and cleaved-Caspase 3 (cCap3) (c), IHC for α-SMA and Picro Sirius Red (d) and IHCs for PD-L1 and CD4 (e) in liver sections from mice treated with vehicle, galunisertib and setanaxib. Scale: 100 µm. Quantification of Red Sirius and Ki67 positive areas and cCasp3, PD-L1 and CD4 positive cells are shown below. Magnifications of CD4 intratumoural staining are shown. Arrows indicate CD4 positive cells. Values are expressed as means ± SEM from 7 animals. *p < 0.05; **p < 0.01; ***p < 0.001; ****p < 0.0001; as compared with untreated mice. f Kaplan-Meier curve of 5-year overall survival of patients from GSE244807 cohort (n = 246) stratified based on enrichment of the setanaxib gene signature showed in Supplementary Fig. 22 (Cox Proportional Hazards model). g CD274/PDL1 expression in patients from GSE244807 cohort stratified as in f. h Activated CD4 infiltration in patients from GSE244807 cohort stratified as in f
Fig. 9
Fig. 9
Impact of different strategies for TGF-β signalling inhibition on intrahepatic cholangiocarcinoma (iCCA) growth. In iCCA, TGF-β exerts suppressor effects on the tumoral cells but promotes cancer-associated fibroblasts (CAF) activation, contributing to the normal tumour growth (left panel). Inhibition of TGF-β signalling at the receptors level blunts TGF-β actions in both cell types, overall resulting in a promotion of tumour growth (middle panel). Inhibiting TGF-β signalling downstream using NOX4/NOX1 dual inhibitors blocks TGF-β mediated CAF activation while maintaining its suppressor effects on the tumour cells, therefore impairing tumour growth (right panel)

References

    1. Banales, J. M. et al. Expert consensus document: Cholangiocarcinoma: current knowledge and future perspectives consensus statement from the European Network for the Study of Cholangiocarcinoma (ENS-CCA). Nat. Rev. Gastroenterol. Hepatol.13, 261–280 (2016). - PubMed
    1. Banales, J. M. et al. Cholangiocarcinoma 2020: the next horizon in mechanisms and management. Nat. Rev. Gastroenterol. Hepatol.17, 557–588 (2020). - PMC - PubMed
    1. Oh, D. Y. et al. Plain language summary of the TOPAZ-1 study: durvalumab and chemotherapy for advanced biliary tract cancer. Future Oncol.19, 2277–2289 (2023). - PubMed
    1. Rimini, M. et al. Durvalumab plus gemcitabine and cisplatin in advanced biliary tract cancer: An early exploratory analysis of real-world data. Liver Int43, 1803–1812 (2023). - PubMed
    1. Kelley, R. K. et al. Pembrolizumab in combination with gemcitabine and cisplatin compared with gemcitabine and cisplatin alone for patients with advanced biliary tract cancer (KEYNOTE-966): a randomised, double-blind, placebo-controlled, phase 3 trial. Lancet401, 1853–1865 (2023). - PubMed

MeSH terms

LinkOut - more resources