. 2025 Aug 18;15(1):30155.
doi: 10.1038/s41598-025-15389-8.

A novel anoikis related gene prognostic model for colorectal cancer based on single cell sequencing and bulk transcriptome analyses

Affiliations

A novel anoikis related gene prognostic model for colorectal cancer based on single cell sequencing and bulk transcriptome analyses

Lei Yang et al. Sci Rep. .

Abstract

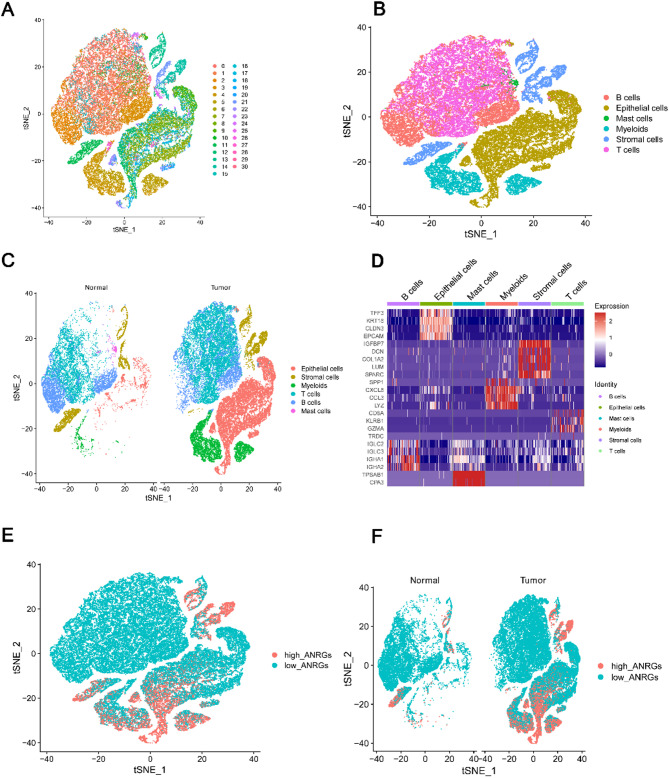
Colorectal cancer (CRC) is a most deadly cancer, and effective prognostic biomarkers are urgently needed. Although anoikis has diverse regulatory roles in tumor progression, the impact of anoikis-related genes (ANRG) by single-cell and bulk transcriptome analyses on the prognostic value for CRC have not been studied. Differentially expressed genes (DEGs) associated with anoikis were obtained by performing single-cell RNA-sequencing (scRNA-seq) analysis in cells with high and low ANRG expression and weighted correlation network analysis (WGCNA) in a bulk RNA sequencing dataset. Key prognostic genes were selected from anoikis associated DEGs by least absolute shrinkage and selection operator (LASSO)-Cox regression analysis, and a prognostic model was established based on the risk score calculated from the expression levels of the identified key prognostic genes. A 10 anoikis-related-gene prognostic model (MGP, TPM2, CRIP2, TUBB6, C1orf54, NOTCH3, LTBP1, CSRP2, FSTL3, and VIM) was developed and the area under the curve (AUC) values of the model in predicting 1-, 3- and 5-year survival probabilities reached 0.744, 0.797, and 0.755, respectively. In conclusion, anoikis related genes could be promising prognostic factors for risk stratification of CRC patients.

Keywords: Anoikis; Colorectal cancer; Prognosis; Single cell sequencing.


Conflict of interest statement

Declarations. Competing interests: The authors declare no competing interests.

Figures

Fig. 1
Fig. 1
Single-cell RNA sequencing (scRNA-seq) data analyses. a A t-SNE plot showing the division of cells into 31 clusters. b A t-SNE plot presenting the annotated 6 cell types from the 31 cell clusters. c A t-SNE plot of cellular compositions in the normal and tumor samples. d A heat map showing the marker genes used to annotate the 6 cell types. e A t-SNE plot illustrating the distribution of cells by the expression levels of anoikis related genes (ANRGs). f A t-SNE plot presenting the distribution of cells by ANRG expression in the normal and tumor samples.
Fig. 2
Fig. 2
Functional enrichment analysis of the differentially expressed genes between the two groups with high and low expression of ANRGs. a The top 5 kyoto encyclopedia of genes and genomes pathways enriched in the ANRG-high and ANRG-low groups. b The top 5 gene ontology biological processes enriched in the ANRG-high and ANRG-low groups. c The top 5 gene ontology cellular components enriched in the ANRG-high and ANRG-low groups. d The top 5 gene ontology molecular functions enriched in the ANRG-high and ANRG-low groups.
Fig. 3
Fig. 3
Weighted correlation network analysis and module-trait analyses. a Selection of the optimal soft threshold power. b Clustering dendrogram. c A heat map showing the correlations between modules and anoikis and cytotoxic T lymphocytes. d A venn plot showing the intersection of anoikis associated DEGs derived from scRNA-seq analysis and anoikis associated genes obtained from WGCNA.
Fig. 4
Fig. 4
Filtering of prognostic genes by univariate cox regression analysis. a A forest plot showing genes significantly associated with the prognosis of patients identified through univariate cox regression analysis. b A forest plot showing genes significantly associated with the prognosis of patients identified through multivariate cox regression analysis. c Expression levels of the identified prognostic genes in TCGA dataset.
Fig. 5
Fig. 5
Construction and evaluation of a prognostic model. a Lasso coefficient profiles of the most relevant prognostic genes (left panel) and ten-fold cross validation for tuning parameter selection in the Lasso model (right panel). b Survival curves showing the association between the risk score and the prognosis in TCGA dataset. c Receiver operating characteristic curves showing the predictive accuracy of the model in predicting 1-, 3- and 5-year survival rates in TCGA dataset. d Survival curves showing the association between the risk score and the prognosis in the GSE17536 dataset. e Receiver operating characteristic curves showing the predictive accuracy of the model in predicting 1-, 3- and 5-year survival rates in the GSE17536 dataset.
Fig. 6
Fig. 6
Identification of independent prognostic factors and establishing a nomogram. a A forest plot showing independent prognostic factors identified in univariate cox regression analysis. b A nomogram for predicting 5- and 3-year survival rates. The total point of a subject could be calculated by adding all the points assigned to each factor, and the subject’s risk could be determined by drawing a perpendicular line from the position of the total point to the probability axis.
Fig. 7
Fig. 7
Infiltrated immune cells and biological pathways enriched in samples with high FSTL3 expression. a A box plot showing the association between FSTL3 expression and tumor stage in TCGA dataset. b A box plot showing the association between FSTL3 expression and tumor stage in the GSE41258 dataset. c KEGG pathways enriched in samples with high FSTL3 expression. d Hallmark pathways enriched in samples with high FSTL3 expression. e The most significantly enriched Hallmark pathway in samples with high FSTL3 expression.

Similar articles

References

    1. Xi, Y. & Xu, P. Global colorectal cancer burden in 2020 and projections to 2040. Transl Oncol.14, 101174 (2021). - PMC - PubMed
    1. Vuik, F. E. et al. Increasing incidence of colorectal cancer in young adults in Europe over the last 25 years. Gut68, 1820–1826 (2019). - PMC - PubMed
    1. Chen, K., Collins, G., Wang, H. & Toh, J. W. T. Pathological features and prognostication in colorectal cancer. Curr. Oncol.28, 5356–5383 (2021). - PMC - PubMed
    1. Gutierrez, A., Demond, H., Brebi, P. & Ili, C. G. Novel methylation biomarkers for colorectal cancer prognosis. Biomolecules11, 1722 (2021). - PMC - PubMed
    1. Luo, X. J. et al. Novel genetic and epigenetic biomarkers of prognostic and predictive significance in stage II/III colorectal cancer. Mol. Ther.29, 587–596 (2021). - PMC - PubMed

Substances