. 2025 Aug;169(8):e70201.
doi: 10.1111/jnc.70201.

Contrasting Behavioural and Biochemical Characteristics of Normal and Spontaneously α-Synuclein-Deficient Mice Treated With MPTP

Affiliations

Contrasting Behavioural and Biochemical Characteristics of Normal and Spontaneously α-Synuclein-Deficient Mice Treated With MPTP

W H Powell et al. J Neurochem. 2025 Aug.

Abstract

α-Synuclein is the primary toxic constituent of Lewy bodies, but its exact function under homeostatic conditions remains elusive. To better understand the role of α-synuclein, we compared two C57BL sub-strains: the normal α-synuclein-expressing J6 and the α-synuclein-deficient J6-OlaHSD, for behavioural, dopaminergic and glial integrity in substantia nigra (SN) and caudate putamen (CPu) before and after 1-methyl-4-phenyl-1,2,3,6-tetrahydropyridine (MPTP) treatment. After MPTP treatment, J6 mice showed significant weight loss (-7% by Day 10), whereas OlaHSD mice maintained stable body weight. At baseline, J6 mice exhibited 33% higher locomotor activity but 38% more thigmotaxis, and 33% less endurance on the Rotarod test than OlaHSD mice. Loss of tyrosine hydroxylase-positive neurons was similar in OlaHSD (-40%) and J6 mice (-34%). J6 mice had double the SN GFAP-ir cells of J6-OlaHSD, a difference that was unchanged by MPTP treatment. In the CPu, MPTP increased GFAP-ir cells in both strains, but Iba1-ir cells significantly increased only in MPTP-treated OlaHSD mice, compared to J6 strain. We further compared the biochemical signatures using Raman micro-spectroscopy. The Raman spectra of the freshly cut SN sections showed a greater shift in the α-helix to β-sheet protein conformation ratio in MPTP-induced J6 mice, likely due to the absence of the Snca1 gene in OlaHSD mice. These findings suggest that the absence of α-synuclein plays a subtle role in the behavioural and neurochemical differences but has no significant effect on dopaminergic neurotransmission. It is therefore concluded that the presence of α-synuclein is important for non-dopaminergic behaviours such as anxiety-like behaviours and regulation of body weight. Under toxic challenge, gliosis in the SN and CPu may be regulated by α-synuclein. This study also emphasises the utility of Raman spectroscopy as a potential tool for identifying subtle protein conformation differences in mice with and without Snca1.

Keywords: 1‐methyl‐4‐phenyl‐1,2,3,6‐tetrahydropyridine (MPTP); GFAP; IBA‐1; Parkinson's disease model; Raman spectroscopy; astrocytes; dopamine neuron; microglia; α‐synuclein; α‐synuclein deficiency.


Conflict of interest statement

The authors declare no conflicts of interest.

Figures

FIGURE 1
FIGURE 1
Changes in body weights during treatment. Body weight following different treatments and in different genotypes were assigned to groups A–D and were compared using a three‐way ANOVA followed by Tukey's post hoc test for differences. Differences were compared using mixed‐effect analysis, n = 6–12, where *p < 0.05. Four days after MPTP treatment, there was a significant difference between groups B and D.
FIGURE 2
FIGURE 2
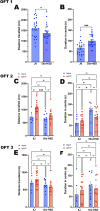
Locomotor profile of 6J and OlaHSD mice for the distance travelled and time duration spent in the centre of the arena following MPTP or vehicle treatment at different sessions in open field test (OFT). Five days prior to treatment with vehicle or MPTP, the basal distance travelled (A) and duration of time spent in the centre of arena (B) showed that OlaHSD mice travelled less (*p = 0.0379; df = 45, one‐tailed Student's t‐test) but spent significantly more time in the centre of the arena (***p = 0.003, df = 44, one‐tailed Student's t‐test). At OFT2 there was a significant difference overall distance travelled (C) by the different mice genotypes, [F(1, 42) = 6.403, p = 0.0152], and the MPTP‐treated J6 mice travelled significantly greater distance compared to all other groups [F(1, 42) = 10.32, p = 0.0025]. Duration in the centre of the arena (D) was only significantly different between genotypes; untreated OlaHSD spending significantly greater time in the centre of arena [F(1, 37) = 8.102, p = 0.0072]. This genotype difference for duration in the centre was maintained in the OFT3 session [F(1, 42) = 5.572, p = 0.0229] (E, F). However, there was no significant difference between treatments on either distance travelled or duration of time spent in the centre of the arena. A Tukey's multiple comparison post hoc test was used in OFT 2 and OFT 3; *p < 0.05, ***p < 0.0001, error bars denote SEM.
FIGURE 3
FIGURE 3
Elevated plus maze profile of 6J and OlaHSD mice for the distance travelled in the elevated plus maze (EPM) and time duration spent in the open arm (OA) following MPTP or vehicle treatment at different sessions. There was no significant difference between 6J and OlaHSD in the distance travelled in the EPM or the duration spent in OA 4 days prior to vehicle or MPTP treatment (A, p = 0.181, df = 17 un‐paired Student's one‐tailed t‐test) and (B, p = 0.105, df = 18 un‐paired Student's one‐tailed t‐test) respectively. Six days following vehicle or MPTP treatment, the distance moved and the time spent in the OA in 6J and OlaHSD genotypes (EPM 2; C, D), were significantly different with regards to MPTP in the distance moved (C) [F(1, 19) = 11.74, p = 0.0028] and duration of movement in the OA (D) [F(1, 19) = 6.556, p = 0.0191]. Eighteen days post vehicle or MPTP treatment (EPM 3; E, F), a similar pattern was seen for distance moved in EPM (E) [F(1, 19) = 10.13, p = 0.0049] and duration in OA (F) [F(1, 19) = 6.529, p = 0.0193]. A two‐way ANOVA followed by Tukey's multiple comparison post hoc was used to compare the effect of MPTP treatment and genotype on locomotor and behavioural responses in panels C–F. *p < 0.05, error bars denote SEM.
FIGURE 4
FIGURE 4
Locomotor coordination using rotarod test (RR) in J6 and OlaHSD mice treated with vehicle or vehicle. Prior to vehicle or MPTP treatment, OlaHSD mice had a significantly greater locomotor coordination than 6J mice (**p = 0.0065, df = 20, one‐tailed Student's un‐paired t‐test; A). Seven days following vehicle or MPTP treatment (RR2) the difference in coordination between the vehicle‐treated genotypes were lost [F(1, 16) = 1.103, p = 0.3093] but MPTP‐treated OlaHSD animals were significantly less coordinated [F(1, 16) = 7.510, *p=0.0145] (B). Nineteen days after vehicle or MPTP treatment the RR3 data showed that all groups were less coordinated (C) and no differences were seen in time to fall in genotype and treatment [F(1, 15) = 0.0237, p = 0.883]. Comparisons were made using a two‐way ANOVA followed by Tukey's multiple comparison post hoc test, error bars denote SEM.
FIGURE 5
FIGURE 5
Representative images of TH‐ir stained SN and CPu in vehicle and MPTP‐treated J6 and OlaHSD mice. Nigral sections were taken from Bregma −2.50 at the nigrostriatal bundle through to Bregma −3.90 at the caudal portion of the SNc (A). Following MPTP treatment the number of TH‐ir neurons in both genotypes were significantly reduced [F(1, 17) = 63.2, p < 0.0001] but the response of the genotypes to MPTP were significantly different [F(1, 17) = 13.46, p = 0.0011] with more TH‐ir loss in the OlaHSD genotype (B). Multiple comparison with Tukey's post hoc test indicated MPTP treatment highly significantly reduced the number of TH‐ir neurons (6J vehicle vs. MPTP, p < 0.0001, and OlaHSD vehicle vs. OlaHSD MPTP, p < 0.0001; B). There also was a greater loss of TH‐ir neurons in the OlaHSD genotype compared J6 (6J MPTP vs. OlaHSD MPTP, p = 0.0059). The number of TH‐ir neurons counted stereologically in each vehicle‐treated genotype were not significantly different (p = 0.206). Low magnification images of striatal TH‐immunoreactivity in OlaHSD mice following systemic vehicle (saline) or MPTP treatment is shown panel C. Representative fluorescence TH‐ir at ×20 for each genotype and treatment group is shown in panel D. Similar to panel C, there was a corresponding reduction of fluorescence staining following MPTP treatment (D). The mean integrated optical density of TH‐ir fibres in the CPu was highly significantly reduced following MPTP in both genotypes (E) [F(1, 17) = 38.0, ****p < 0.0001] but there were no significant differences in the TH‐ir in the vehicles treated genotypes [F(1, 19) = 0.260, p = 0.615]. Two‐way ANOVA followed by Tukey's multiple comparison post hoc test indicated ****p < 0.0001, **p < 0.01 and *p < 0.05. n = 6–12, error bars denote SEM. The arrows in the panel A indicate TH‐ir neurons. Scale bar in panel D represents 50 μm.
FIGURE 6
FIGURE 6
Representative images of GFAP‐ir immunofluorescence (green) in the saline‐ or MPTP‐treated mice SN (Aa–Ad) and CPu (Ba–Bd) are shown. Panels Aa, Ab, Ba and Bb represent 6J and Ac, Ad, Bc and Bd are images of OlaHSD mice. The Iba‐1‐ir representative images (red) showing saline‐ or MPTP‐treated SN (Ca–Cd) and the CPu (Da–Dd) of 6J and OlaHSD mice. Mean optical density of GFAP‐ir in the SN (E) of the two mouse strains were statistically different [F(1, 17) = 8.568 p = 0.0094] but MPTP treatment did results in a significant change [F(1, 17) = 0.696, p = 0.415]. Tukey's multiple comparison post hoc test indicated that a significant difference between the optical density of GFAP‐ir following MPTP treatment between 6J and OlaHSD mice (p = 0.0424). In the CPu (F), no statistical difference in GFAP‐ir was observed between genotypes [F(1, 19) = 0.930, p = 0.346] but MPTP treatment significantly increased GFAP‐ir in both genotypes [F(1, 19) = 63.48 p < 0.0001]. In the SN, there was no statistically significant difference between Iba‐1‐ir (G) in the vehicle‐treated genotypes [F(1, 18) = 0.175, p = 0.680] but MPTP treatment lead to significant increase in Iba‐1‐ir [F(1, 18) = 14.60, p = 0.0013]. However, there was statistically significant difference between Iba‐1‐ir in the CPu (H) of vehicle‐treated genotypes [F(1, 18) = 12.47, p = 0.0024]. Treatment with MPTP did not have an overall significant effect [F(1, 18) = 2.990, p = 0.1009]. Two‐way ANOVA followed by Tukey's multiple comparison post hoc test indicated ****p < 0.0001, **p < 0.01 and *p < 0.05. n = 6–12, error bars denote SEM. The arrows in the panel A indicate TH‐ir neurons. Scale bar in panel D represents 50 μm.
FIGURE 7
FIGURE 7
Average Raman spectra of maps covering substantia nigra pars compacta (SNc) from drug‐naïve (A) and MPTP (B) treated J6 and OlaHSD mice brain sections scanned using micro‐Raman.
FIGURE 8
FIGURE 8
Jackson (J6) versus OlaHSD measurements, Amide‐I peak deconvolutions. Four Gaussian spectra are used for analysis. The panels depict peak analysis of Amide‐I for the average Raman spectrum for control samples (6J, A) and (OlaHSD, B) and MPTP samples (6J, C) and (OlaHSD, D) of the entire scan of each area associated with sub‐strains. The average spectrum displays a reasonable signal‐to‐noise ratio, and Amide‐I peak deconvolution represents a good basis for secondary structure analysis. Constraints in peak deconvolution are introduced relative to peak position according to peak analysis of Maiti et al. (2004).

Similar articles

References

    1. Agirman, G. , Yu K. B., and Hsiao E. Y.. 2021. “Signaling Inflammation Across the Gut‐Brain Axis.” Science 374, no. 6571: 1087–1092. - PubMed
    1. Apetri, M. M. , Maiti N. C., Zagorski M. G., Carey P. R., and Anderson V. E.. 2006. “Secondary Structure of α‐Synuclein Oligomers: Characterization by Raman and Atomic Force Microscopy.” Biochemical Journal 355, no. 1: 63–71. - PubMed
    1. Ayton, S. , George J. L., Adlard P. A., Bush A. I., Cherny R. A., and Finkelstein D. I.. 2013. “The Effect of Dopamine on MPTP‐Induced Rotarod Disability.” Neuroscience Letters 543: 105–109. - PubMed
    1. Chandra, S. , Gallardo G., Fernández‐Chacón R., Schlüter O. M., and Südhof T. C.. 2005. “α‐Synuclein Cooperates With CSPα in Preventing Neurodegeneration.” Cell 123, no. 3: 383–396. - PubMed
    1. Chesselet, M. F. 2008. “In Vivo Alpha‐Synuclein Overexpression in Rodents: A Useful Model of Parkinson's Disease?” Experimental Neurology 209: 22–27. - PMC - PubMed

LinkOut - more resources