. 2025 Jul 24:27:3565-3578.
doi: 10.1016/j.csbj.2025.07.036. eCollection 2025.

Deciphering the proteome of Escherichia coli K-12: Integrating transcriptomics and machine learning to annotate hypothetical proteins

Affiliations

Deciphering the proteome of Escherichia coli K-12: Integrating transcriptomics and machine learning to annotate hypothetical proteins

Sagarika Chakraborty et al. Comput Struct Biotechnol J. .

Abstract

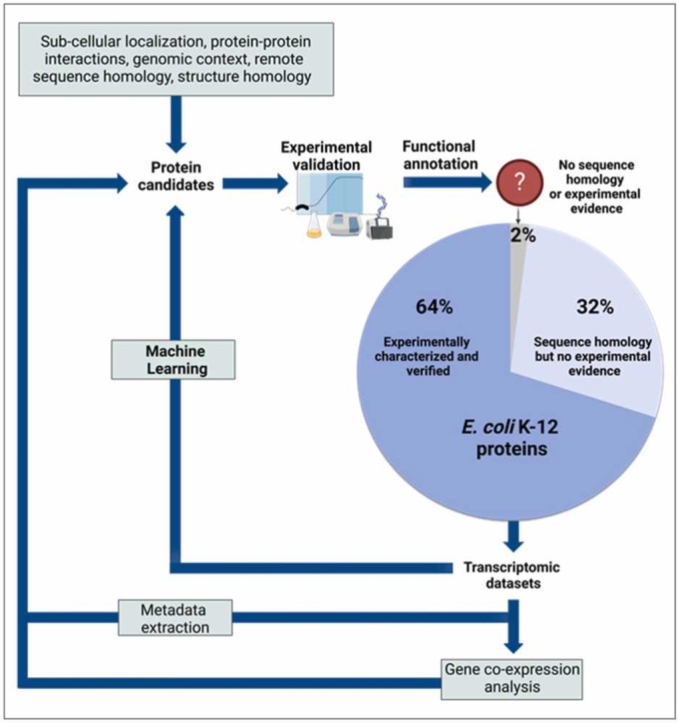
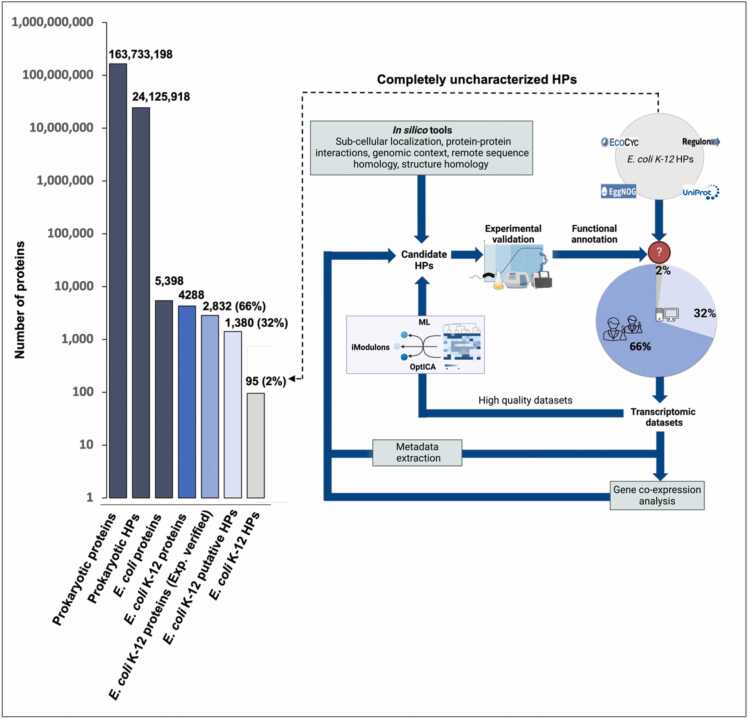
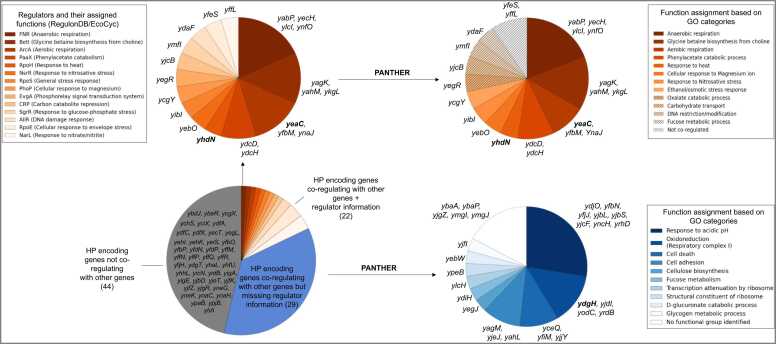
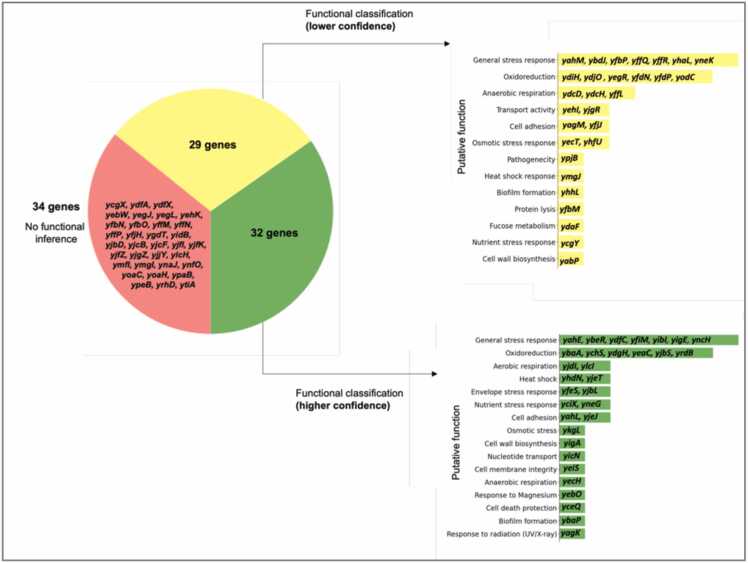
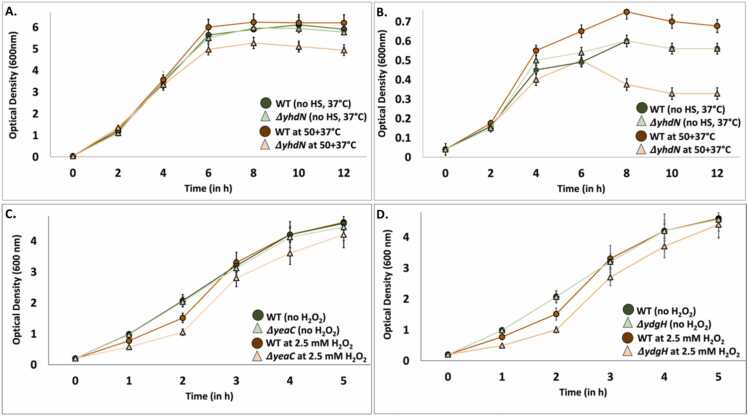
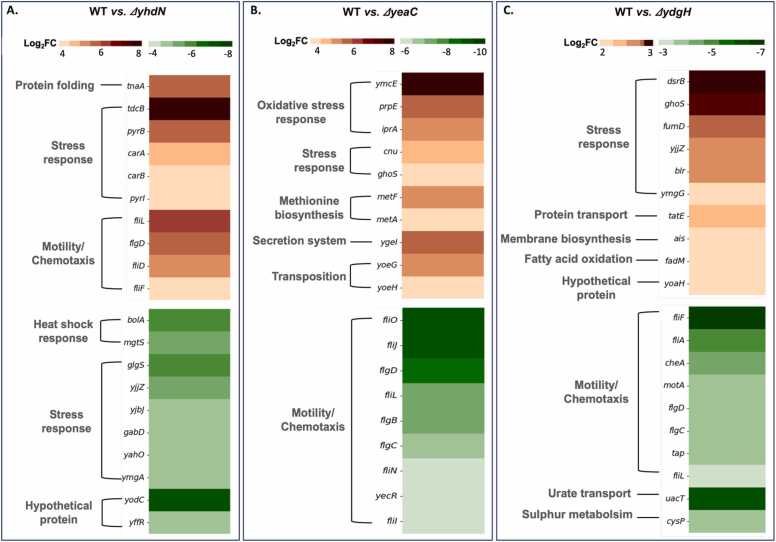
Omics technologies have led to the discovery of a vast number of proteins that are expressed but have no functional annotation - so called hypothetical proteins (HPs). Even in the best-studied model organism Escherichia coli K-12, over 2 % of the proteome remains uncharacterized. This knowledge gap becomes even worse when looking at microbial dark matter. However, knowing the functions of proteins is crucial for elucidating cellular and metabolic processes and harnessing biotechnological potentials. Here, we employed machine learning to decipher the transcriptional regulatory network of E. coli K-12, as well as other in silico tools to assign functions to uncharacterized HPs. We further provide experimental validation of in silico predicted functions for three HP-encoding genes (yhdN, yeaC and ydgH) as proof of concept, by analyzing growth patterns of deletion mutants compared to the wild type, as well as their transcriptional responses to specific conditions. This study demonstrates that the use of Big Omics Data in combination with Artificial Intelligence and experimental controls is a powerful approach to illuminate functional dark matter.

Keywords: Artificial intelligence; Big omics data; Functional annotation of proteins; Functional dark matter; Independent Component Analysis (ICA).


Conflict of interest statement

The authors declare that they have no conflict of interest.

Figures

None
Graphical abstract
Fig. 1
Fig. 1
Total number of sequences for all unique prokaryotic and Escherichia coli proteins deposited in the National Center for Biotechnology Information (NCBI) as of April 2024 and methodological set-up of this study. Of the 4288 genes in E. coli K-12 protein encoding genes analyzed - combining annotations from the MG1655 and BW25113 substrains - 1380 genes (32 %) encode for unique proteins with functions predicted only in silico based on homologous sequences but lacking in vivo or in vitro experimental evidence (termed “putative hypothetical proteins”). 95 protein encoding genes (2 %) of E. coli K-12 are completely uncharacterized with no sequence homologues according to the four knowledge databases - EcoCyc , RegulonDB , EggNOG and UniProt (termed “hypothetical proteins”). Transcriptomic datasets from NCBI were filtered and processed using the OptICA approach to generate iModulons . Metadata information was curated in parallel using manual or semi-automated approaches, .Bioinformatics, machine learning and deep learning tools along with the presence of relevant metadata then resulted in potential functions for HP candidates for in vitro testing. Exp., experimentally; HPs, hypothetical proteins; ICA, independent component analysis; ML, machine learning.
Fig. 2
Fig. 2
Regulator and functional classification for 95 HP-encoding genes in Escherichia coli K-12. 44 HP-encoding genes could not be clustered by the OptICA method (grey), since they did not co-regulate with any other genes. 22 genes were characterized based on information on their regulators as obtained from RegulonDB and/or EcoCyc, as well as by GO categories based on the co-regulating genes using the PANTHER tool (Protein ANalysis THrough Evolutionary Relationships) (orange) . 29 genes co-regulated with other genes, but no information on their regulators could be obtained (blue). 24 out of these 29 genes could be assigned putative functions based on GO annotations of co-regulating genes derived from the PANTHER tool. The striped regions denote genes where the regulator-associated function from EcoCyc/RegulonDB did not match a GO-derived functional category obtained from PANTHER. Highlighted in bold are the three HP-encoding genes which were selected for in vitro testing.
Fig. 3
Fig. 3
Classification of HP-encoding genes based on in silico tools regarding their confidence of assignment and functional categories. 95 HP-encoding genes were classified into three categories. 32 genes (in green) could be assigned a function with a ‘higher’ confidence while 29 genes (yellow) were categorized with a ‘lower’ confidence. 34 genes (red) could not be functionally annotated. A ‘higher’ confidence implies well-correlated information from three or more in silico tools/databases (sources). A ‘lower’ confidence implies information could only be correlated from at least two sources. Genes with higher and lower confidence were functionally categorized based on all available in silico information (from Table S1).
Fig. 4
Fig. 4
Growth curves of E. coli K-12 BW25113 wild type (WT) and isogenic deletion mutants. (A, B) Effect of transient heat shock on WT and ΔyhdN cells. WT and the respective mutant strain were exposed to a transient heat shock at 50°C for 7 min, (at OD600 nm= 0.04) and grown for 12 h in A. LB medium and B. in Nitrogen-limited M9 medium. (C, D) Bacterial growth of WT and respective mutants at 37°C exposed to sub-lethal concentration of 2.5 mM H2O2, added during the exponential phase (OD600 nm = 0.2) and grown for 5 h. C. WT and ΔyeaC and D. WT and ΔydgH cells. WT are indicated by filled circles () and mutants by filled triangles (). Green lines represent controls, orange lines stress conditions. Average of three independent readings taken for each specified condition. Error bars on the graph indicate standard deviation from the mean.
Fig. 5
Fig. 5
Comparative differential gene expression analysis in A. wild type (WT) vs. ΔyhdN, B. WT vs. ΔyeaC and C. WT vs. ΔydgH strains. Top ten positively and negatively expressed DEGs are shown. Each row represents a gene, and colour intensity represents the Log2 Fold Change (Log2 FC), with red indicating upregulation in WT and green indicating upregulation in the mutant strains. Functional categories were based on information retrieved from Literature and EcoCyc.

Similar articles

References

    1. Consortium TU UniProt: the Universal Protein Knowledgebase in 2023. Nucleic Acids Res. 2023;51:D523–D531. doi: 10.1093/nar/gkac1052. - DOI - PMC - PubMed
    1. Paysan-Lafosse T., Blum M., Chuguransky S., Grego T., Pinto B.L., Salazar G.A., et al. InterPro in 2022. Nucleic Acids Res. 2023;51:D418–D427. doi: 10.1093/nar/gkac993. - DOI - PMC - PubMed
    1. Mistry J., Chuguransky S., Williams L., Qureshi M., Salazar G.A., Sonnhammer E.L.L., et al. Pfam: The protein families database in 2021. Nucleic Acids Res. 2021;49:D412–D419. doi: 10.1093/nar/gkaa913. - DOI - PMC - PubMed
    1. Sigrist C.J.A., de Castro E., Cerutti L., Cuche B.A., Hulo N., Bridge A., et al. New and continuing developments at PROSITE. Nucleic Acids Res. 2013;41:D344–D347. doi: 10.1093/nar/gks1067. - DOI - PMC - PubMed
    1. Letunic I., Khedkar S., Bork P. SMART: recent updates, new developments and status in 2020. Nucleic Acids Res. 2021;49:D458–D460. doi: 10.1093/nar/gkaa937. - DOI - PMC - PubMed

LinkOut - more resources