. 2025 Jul 31:16:1636977.
doi: 10.3389/fimmu.2025.1636977. eCollection 2025.

Unveiling ammonia-induced cell death: a new frontier in clear cell renal cell carcinoma prognosis

Affiliations

Unveiling ammonia-induced cell death: a new frontier in clear cell renal cell carcinoma prognosis

Peize Yu et al. Front Immunol. .

Abstract

Background: Clear cell renal cell carcinoma (KIRC) is the most aggressive renal carcinoma subtype of renal carcinoma, characterized by high mortality, early metastasis, and resistance to treatment. Ammonia-induced cell death (AICD) has recently been identified as a novel metabolic mechanism influencing tumor progression, yet its prognostic implication and regulatory networks in KIRC remain underexplored.

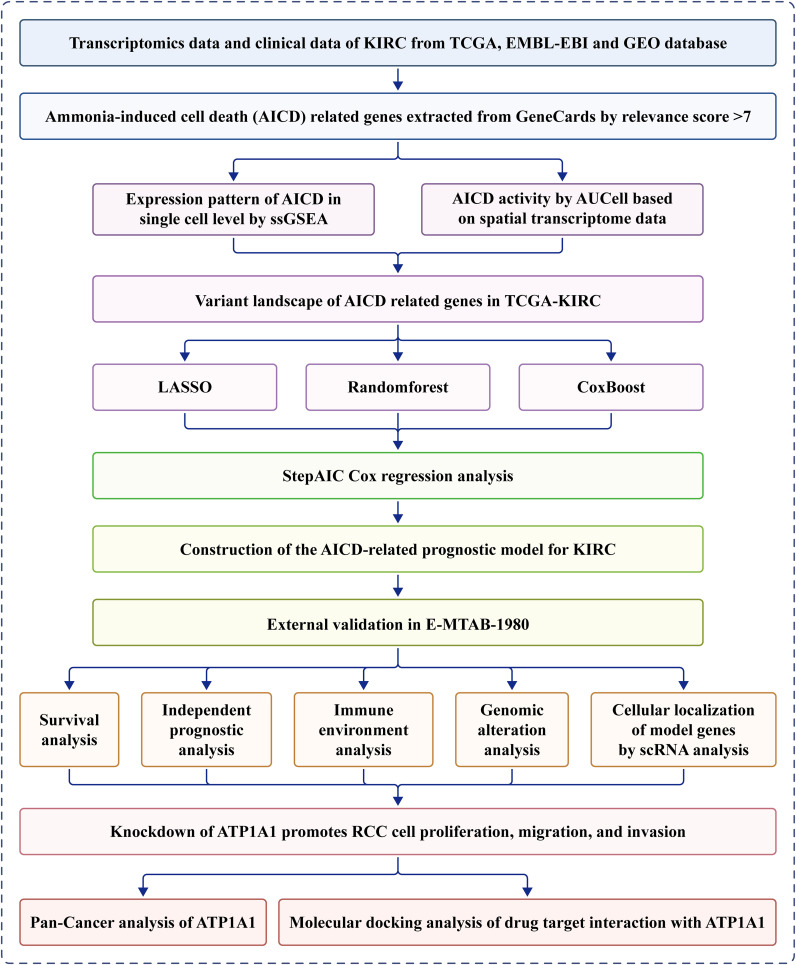
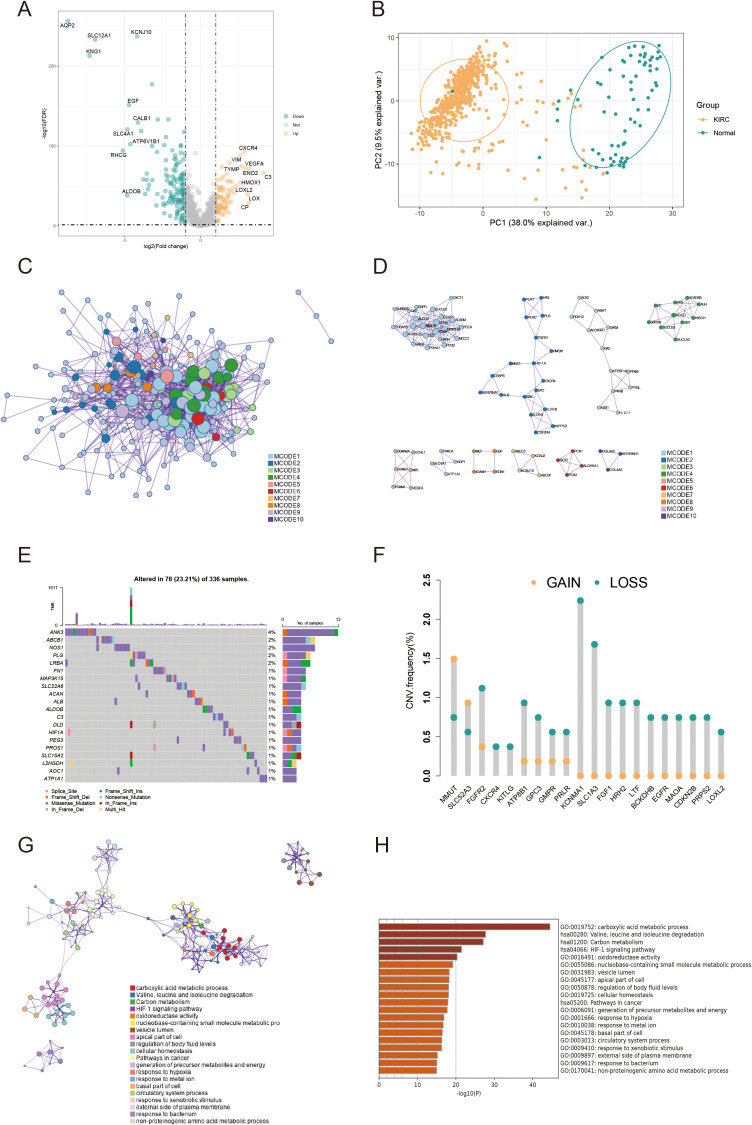
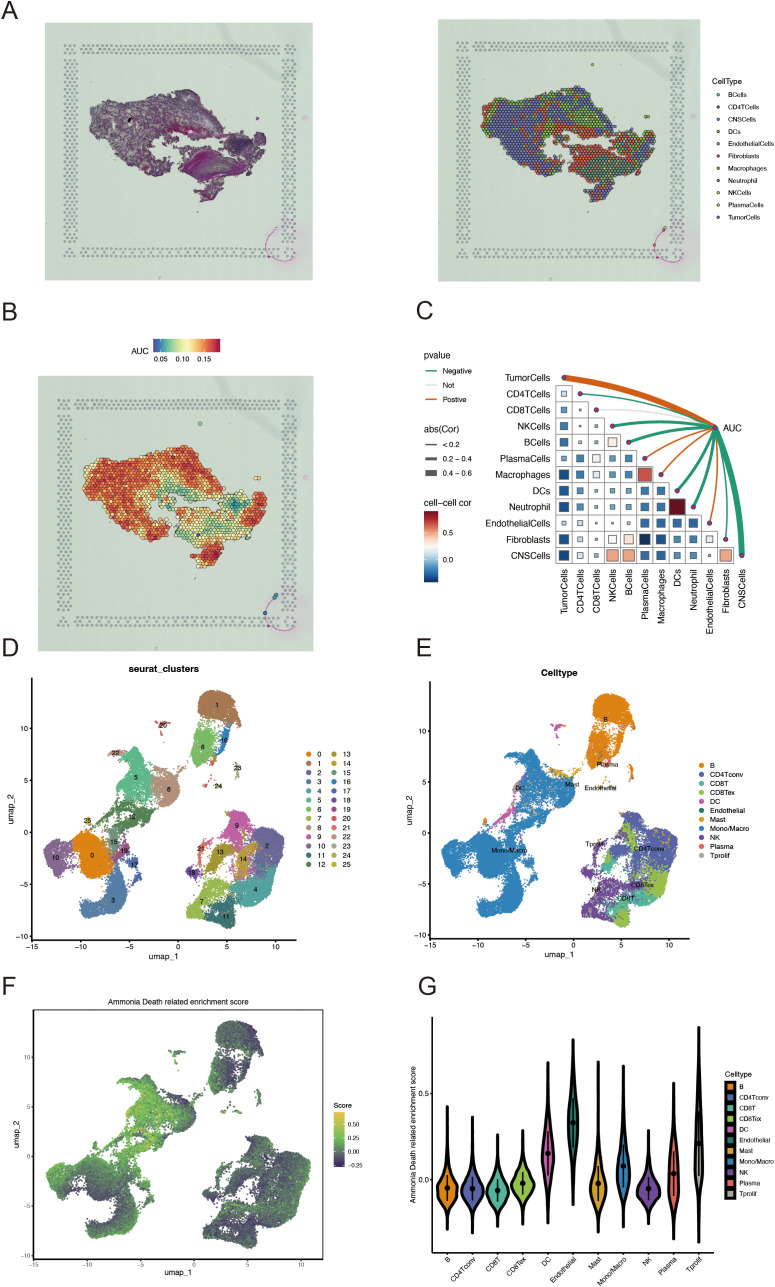
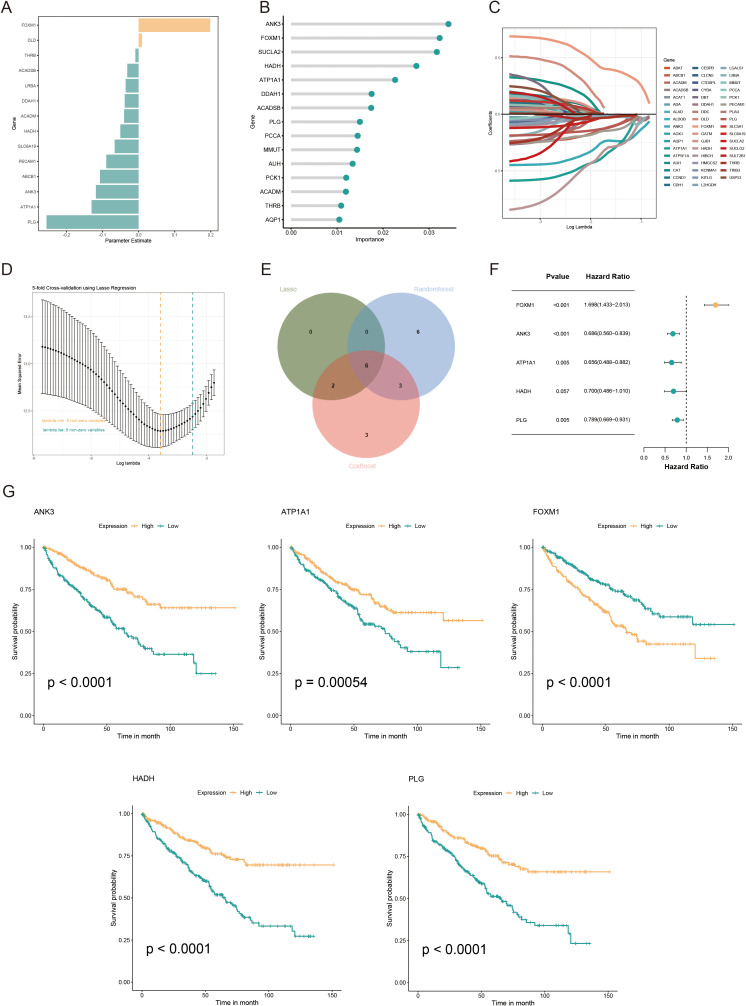
Methods: Transcriptomic and clinical information from the TCGA-KIRC cohort and the validation cohort (E-MTAB-1980) were analyzed. Differentially expressed AICD-related genes were identified through differential expression analysis, univariate Cox regression, and machine learning algorithms (LASSO, random forest, and CoxBoost). A prognostic risk model was developed via multivariate Cox regression. Spatial and single-cell transcriptomics were employed to characterize the immune microenvironment heterogeneity. Cell-based experiments were performed to investigate the potential involvement of ATP1A1 in KIRC. Molecular docking and pan-cancer analyses were conducted to identify therapeutic candidates and ATP1A1-related mechanisms.

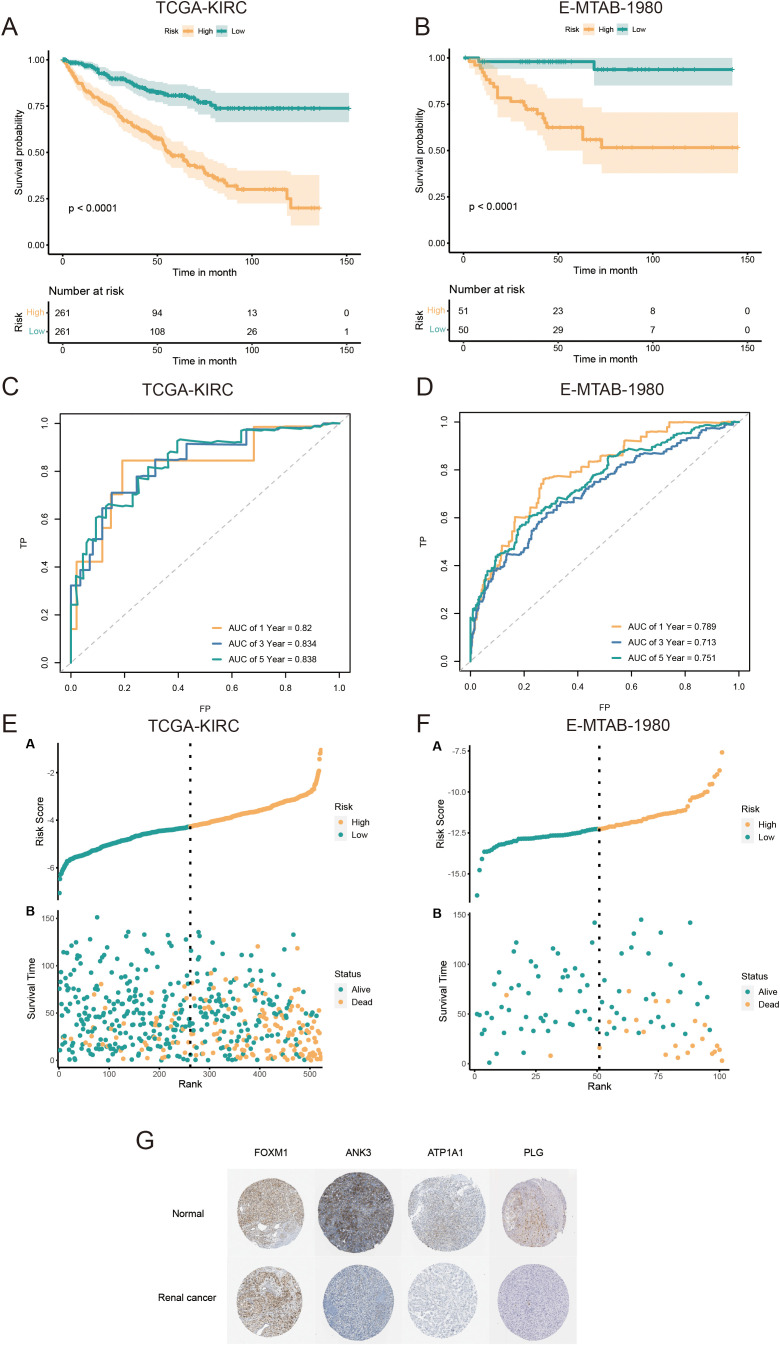
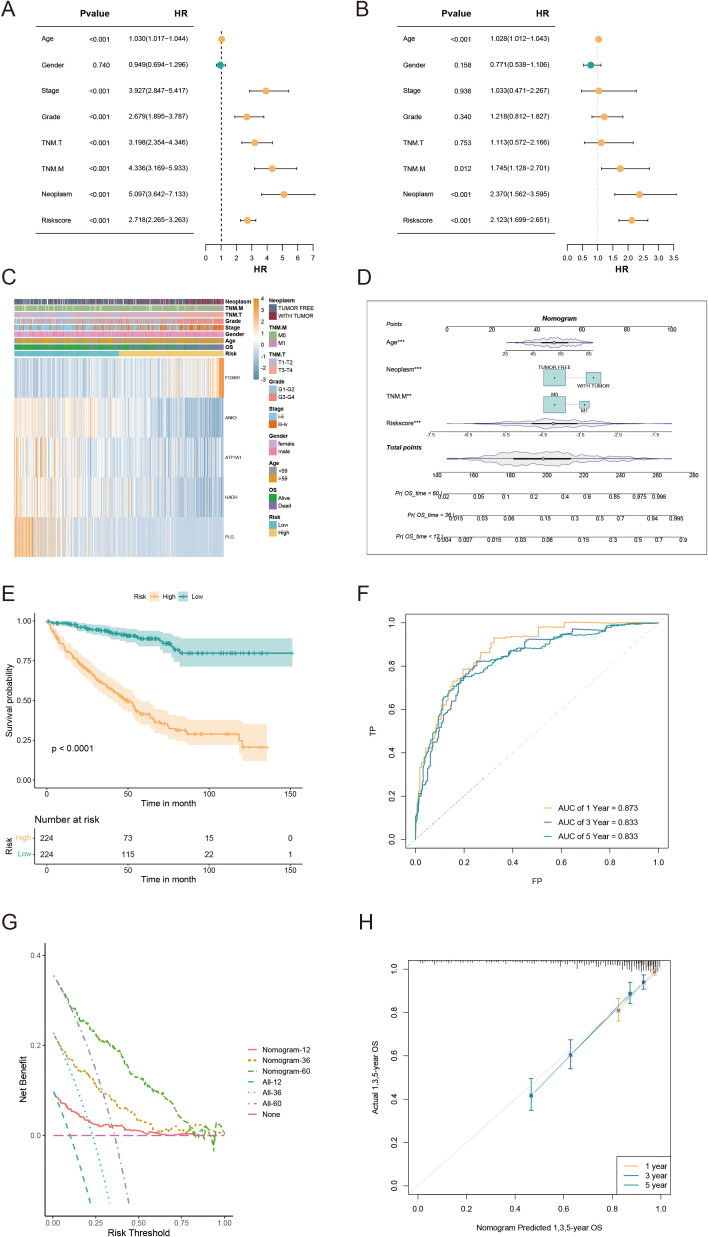
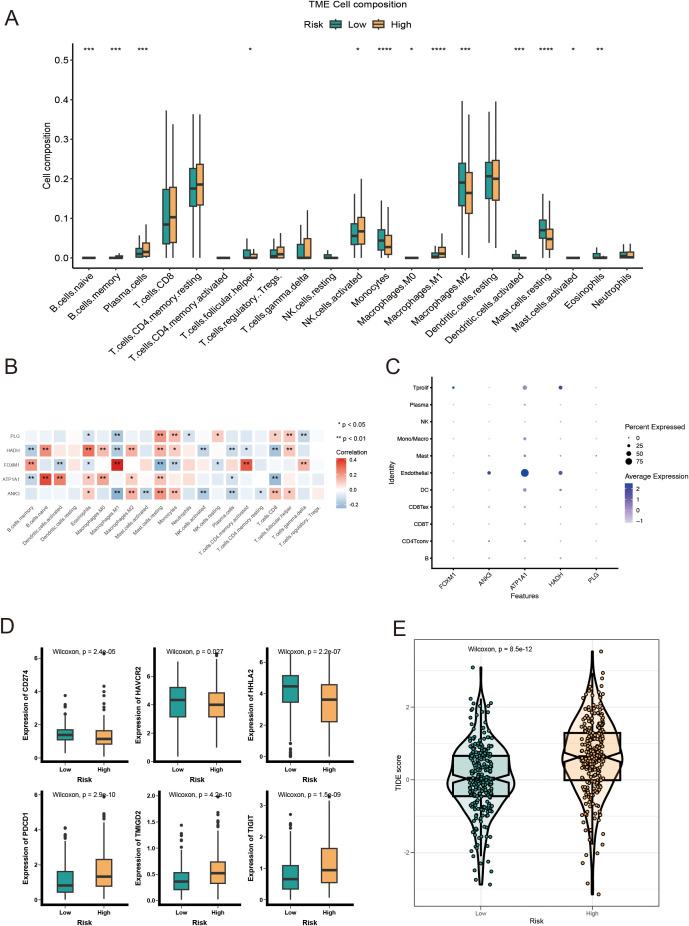
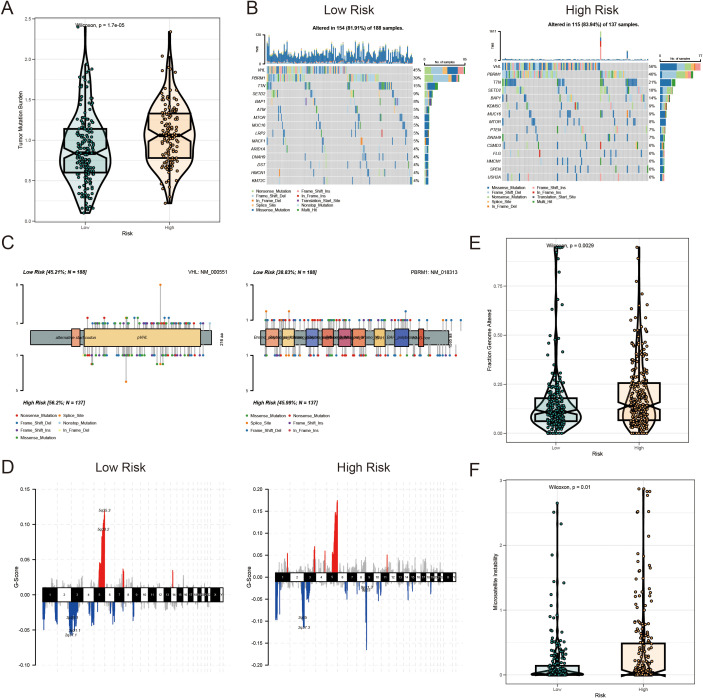
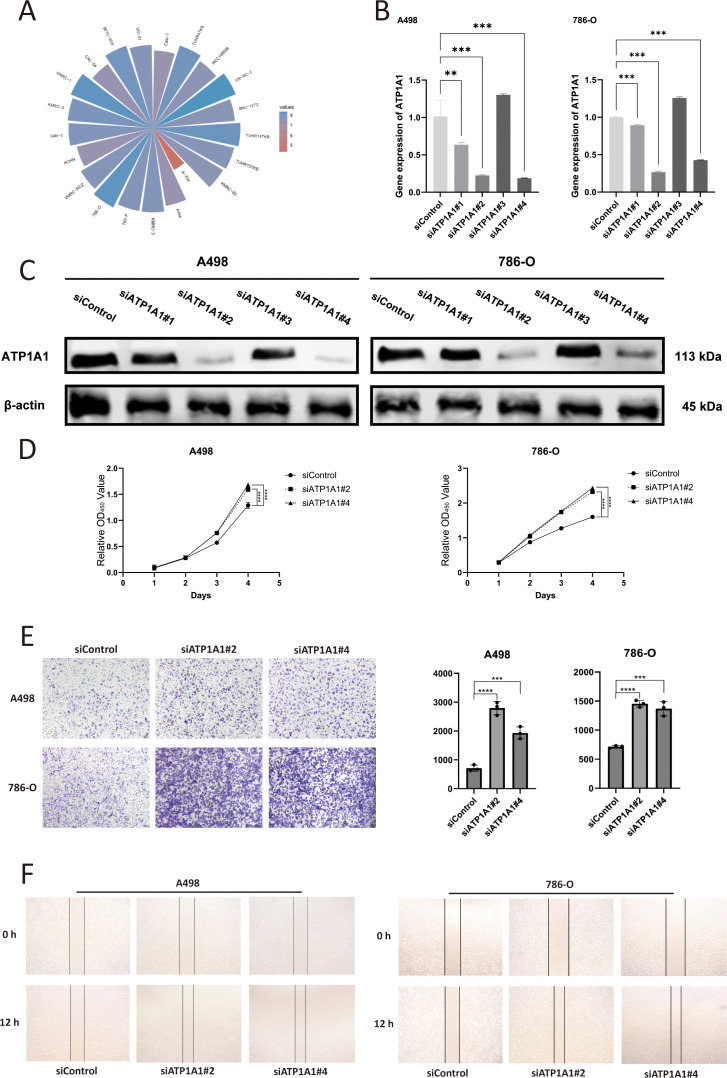
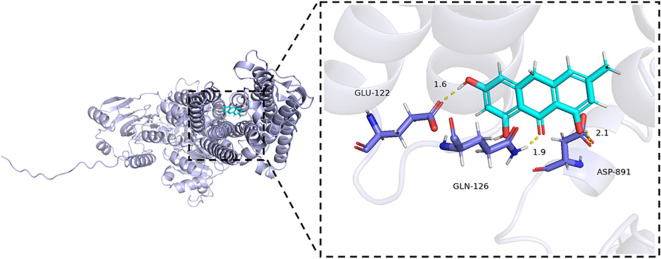
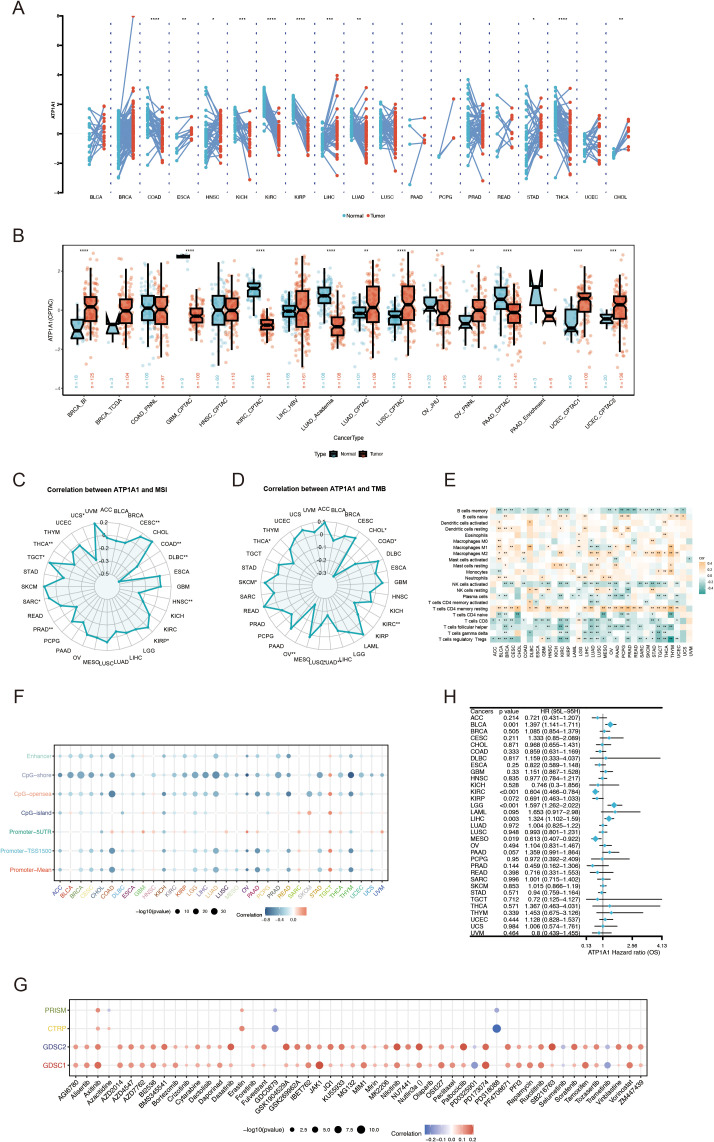
Results: Five AICD-related genes (FOXM1, ANK3, ATP1A1, HADH, and PLG) were identified and selected to construct a risk score model. The model demonstrated high accuracy and was integrated into a nomogram for clinical application. High-risk (HR) patients exhibited immunosuppressive microenvironments, elevated tumor mutational burden (TMB), and genomic instability. In vitro functional assays confirmed that ATP1A1 knockdown significantly enhanced the proliferative, migratory, and invasive capabilities of renal carcinoma cells (A498 and 786-O), suggesting a suppressive role for ATP1A1 in malignant tumor progression. ATP1A1, a core gene, was associated with metabolic reprogramming and chemotherapy sensitivity across multiple cancers. Molecular docking revealed Emodinanthrone as a high-affinity ligand for ATP1A1 (-6.8 kcal/mol).

Conclusion: This study identifies an AICD-associated gene signature as a robust prognostic tool for KIRC, revealing its interactions with immune evasion and genomic instability. ATP1A1 is proposed as a promising therapeutic target, with Emodinanthrone emerging as a novel drug candidate. These findings contribute to the advancement of personalized treatment strategies for KIRC patients.

Keywords: ATP1A1; ammonia-induced cell death; clear cell renal cell carcinoma; immune microenvironment; metabolic reprogramming; prognostic risk model.


Conflict of interest statement

The authors declare that the research was conducted in the absence of any commercial or financial relationships that could be construed as a potential conflict of interest.

Figures

Figure 1
Figure 1
Flowchart of this study.
Figure 2
Figure 2
Variant landscape and functional characterization of AICD genes in KIRC patients. (A) Volcano plot depicting differentially expressed AICD-related genes (DEARGs) in KIRC (green: down-regulated DEARGS; yellow: up-regulated DEARGS; grey: unaltered genes), with FDR<0.5 and |log2FC|>1. (B) PCA showing obvious differences between KIRC and normal samples. (C) PPI network of AICD-related DEARGS constructed based on the Metascape database. (D) Identification of significant subnetworks through the MCODE algorithm. (E) Oncoplot of the top 20 AICD-related DEARGs in the TCGA cohort. (F) Rates of CNV loss, gain, and no CNV among the top 20 AICD-related DEARGS. (G, H) Functional enrichment analyses of AICD-related DEARGS.
Figure 3
Figure 3
Characterization of AICD activity in spatial transcriptomics and single-cell RNA sequencing. (A) Spatial transcriptomics data of KIRC. (B) Spatial visualization of AICD intensity. (C) Spearman correlation assessment of the spatial profiles of AICD activity within the tumor microenvironment. (D, E) Identification of single cell types using marker genes. (F) AICD-related enrichment scores. (G) Distribution of AICD activity across different cell types.
Figure 4
Figure 4
Development and validation of an AICD-associated prognostic signature for KIRC patients. (A) Feature selection according to the CoxBoost algorithm. (B) Identification of optimal biomarkers using the Random Forest (RF) algorithm. (C, D) Variable selection in the LASSO-Cox regression model. (E) Venn diagram indicating overlapping identified by the three algorithms. (F) Forest plots of the final 5 prognostic genes selected through stepAIC regression analysis. (G) Survival analysis of the prognostic genes in the TCGA-KIRC cohort.
Figure 5
Figure 5
Validation and prognostic performance of the AICD-related signature in KIRC patients. OS of LR and HR patients in the TCGA-KIRC (A) and E-MTAB-1980 (B) cohorts. ROC curves of the prognostic model for estimating survival in the TCGA-KIRC (C) and E-MTAB-1980 (D) cohorts. (Risk score distribution stratified by survival status and time in the TCGA-KIRC (E) and E-MTAB-1980 (F) cohorts. (G) Expression of core prognostic model genes in renal cancer and normal tissues via the HPA database.
Figure 6
Figure 6
Nomogram development and evaluation for prognostic prediction in KIRC patients. (A, B) Univariate/multivariate Cox analyses of clinicopathologic traits and risk score in the TCGA-KIRC cohort. (C) Distribution of clinical characteristics and expression of model genes based on the AICD-related risk score. (D) Nomogram for predicting the prognosis of KIRC patients. (E) Kaplan-Meier survival analysis comparing LR and HR groups based on the nomogram score. (F) ROC curve analysis of the nomogram in the TCGA-KIRC cohort. (G) Calibration plots for predicting 1-, 3-, and 5-year overall survival in TCGA-KIRC. (H) DCA showing the net benefits of the nomogram compared to other clinical characteristics.
Figure 7
Figure 7
Immune landscape analysis of LR and HR KIRC patients based on AICD-related prognostic model. (A) Boxplot showing the abundance of 22 infiltrating immune cell types computed via CIBERSORT. (B) Correlation between TME infiltrating immune cells and genes in the AICD-related prognostic model. (C) Bubble plot indicating the average and percentage expression of prognostic biomarkers among diverse cell subtypes. (D) Boxplot illustrating the expression levels of IC-associated genes. (E) Violin plot of TIDE scores across risk groups. *p<0.5; **p<0.1; ***p<0.01; ****p<0.001.
Figure 8
Figure 8
Mutation landscape of AICD-related prognostic subgroups in KIRC. (A) TMB analysis. (B) Waterfall plot depicting somatic mutation characteristics in HR and LR groups. (C) Comparison of several mutation loci in VHL and PBRM1 between risk groups. (D) CNV patterns in LR and HR groups. (E) FGA differences between risk groups. (F) Comparison of MSI across risk score categories.
Figure 9
Figure 9
The effect of ATP1A1 gene knockdown on the malignant biological functions of RCC cells. (A) ATP1A1 expression across RCC cell lines based on CCLE data. (B) mRNA level of ATP1A1 after siATP1A1 transfection. (C) Western blot analyses confirm the efficiency of ATP1A1 knockdown in A498 and 786-O cells. (D) Cell proliferation after ATP1A1 knockdown. (E) A498 and 786-O cells transwell invasion image after ATP1A1 knockdown. (F) A498 and 786-O cells scratching after ATP1A1 knockdown. 0.1234(ns), 0.0332(*), 0.0021(**), 0.0002(***), <0.0001(****).
Figure 10
Figure 10
Molecular docking analysis of ATP1A1 and Emodinanthrone. A detailed 3D molecular docking model illustrating the binding affinity and interaction between ATP1A1 and Emodinanthrone. The protein is shown in blue, and the Emodinanthrone compound is depicted in cyan. Key residues are represented as sticks, with hydrogen bond interactions between amino acids and Emodinanthrone indicated by yellow dashed lines.
Figure 11
Figure 11
Pan-cancer analysis of ATP1A1 expression, immune features, and genetic alterations. (A) ATP1A1 expression levels across TCGA tumor types and adjacent normal tissues. (B) Differential ATP1A1 protein levels (mass spectrometry) between cancer and normal tissues in the CPTAC database. (C) Correlation between ATP1A1 expression and MSI across TCGA datasets. (D) Association between ATP1A1 expression and TMB in TCGA datasets. (E) Heatmap showing the relationship between ATP1A1 expression and immune cell infiltration among various cancers. (F) Pearson correlation between ATP1A1 expression and immune-related genes in pan-cancer. (G) Spearman correlation between ATP1A1 expression and chemotherapy drug sensitivity across pan-cancer. (H) Pan-cancer Cox regression analysis of ATP1A1 as a prognostic factor across TCGA cancers. *p < 0.05; ***p < 0.001; ****p < 0.0001.

Similar articles

References

    1. Bex A, Albiges L, Ljungberg B, Bensalah K, Dabestani S, Giles RH, et al. Updated European association of urology guidelines for cytoreductive nephrectomy in patients with synchronous metastatic clear-cell renal cell carcinoma. Eur Urol. (2018) 74:805–9. doi: 10.1016/j.eururo.2018.08.008, PMID: - DOI - PubMed
    1. Bahadoram S, Davoodi M, Hassanzadeh S, Bahadoram M, Barahman M, Mafakher L. Renal cell carcinoma: an overview of the epidemiology, diagnosis, and treatment. G Ital Nefrol. (2022) 39., PMID: - PubMed
    1. Botrugno OA, Fayard E, Annicotte JS, Haby C, Brennan T, Wendling O, et al. Synergy between LRH-1 and beta-catenin induces G1 cyclin-mediated cell proliferation. Mol Cell. (2004) 15:499–509. doi: 10.1016/j.molcel.2004.07.009, PMID: - DOI - PubMed
    1. Han X, Song D. Using a machine learning approach to identify key biomarkers for renal clear cell carcinoma. Int J Gen Med. (2022) 15:3541–58. doi: 10.2147/ijgm.S351168, PMID: - DOI - PMC - PubMed
    1. Cao Q, Ruan H, Wang K, Song Z, Bao L, Xu T, et al. Overexpression of PLIN2 is a prognostic marker and attenuates tumor progression in clear cell renal cell carcinoma. Int J Oncol. (2018) 53:137–47. doi: 10.3892/ijo.2018.4384, PMID: - DOI - PMC - PubMed

LinkOut - more resources