. 2025 Aug 1:16:1624142.
doi: 10.3389/fimmu.2025.1624142. eCollection 2025.

Analysis of epidemiology and nomogram construction for prediction and clinical decision-making in gliomas

Affiliations

Analysis of epidemiology and nomogram construction for prediction and clinical decision-making in gliomas

Yuxin Zhao et al. Front Immunol. .

Abstract

Background: Gliomas are the most common primary malignant brain tumors with high mortality. Exploring the epidemiologic characteristics and prognostic factors of gliomas, and constructs a nomogram-based predictive model can help to evaluate the public health impact, optimize risk stratification, and guide treatment decision-making.

Methods: This cross-sectional epidemiological analysis used the most recently released data from the Surveillance, Epidemiology, and End Results (SEER) database from January 1, 2000, to December 31, 2019. The SEER-18 database provided data for incidence, prevalence, survival, and initial treatment, as well as the establishment and validation of a nomogram to predict the survival probability of individual patients with gliomas.

Results: Among 71,040 cases of glioma patients, the majority were male (40,500 [57.01%]) and White race (52,443 [73.82%]), with glioblastoma (41,125 [57.89%]) as the predominant histology type, primarily located at the cerebrum (49,307 [69.41%]), and mostly categorized as high-grade tumors (22,447 [31.60%]). The age-adjusted incidence rate of gliomas decreased from 4.42 per 100,000 persons in 2000 to 3.81 per 100,000 persons in 2019 [APC of -0.53 (95%CI, -0.71 to -0.34)]. In the incidence analysis among different tumor histology, grade and primary site, glioblastoma, high-grade tumor and primary site of cerebrum were with the highest incidence, respectively. Additionally, the incidence of different histology varied significantly among different age groups. In the multivariable analysis, age, histology, grade, site and treatment (chemotherapy, radiation and surgery) were identified as prognostic factors. Among these factors, age and grade had the most significant impact on prognosis. Furthermore, a predictive nomogram model for 1-/3-/5-year survival rates of gliomas was developed, incorporating the prognostic factors. For the training and test cohorts, the concordance indexes of the nomogram were 0.796 (95%CI, 0.792-0.805) and 0.799 (95%CI, 0.793-0.808), respectively.

Conclusion: The incidence and survival of gliomas showed significant variations across different age, histology, grade, site, and treatment groups. The nomogram model based on these factors could accurately predict the survival among patients with gliomas and aid in optimizing treatment decisions.

Keywords: epidemiology; gliomas; initial treatment; nomogram; prognosis.


Conflict of interest statement

The authors declare that the research was conducted in the absence of any commercial or financial relationships that could be construed as a potential conflict of interest.

Figures

Figure 1
Figure 1
A flowchart of patient selection and study design. ICD-O-3, International Classification of Diseases for Oncology, Third Edition, and site codes.
Figure 2
Figure 2
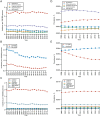
Incidence and 10-years limited prevalence of gliomas by sex, race and ethnicities, age at diagnosis. (A) Incidence of gliomas by sex. (B) Incidence of gliomas by race and ethnicities. (C) Incidence of gliomas by age at diagnosis. (D) 10-years limited prevalence of gliomas by sex. (E) 10-years limited prevalence of gliomas by race and ethnicities. (F) 10-years limited prevalence of gliomas by age at diagnosis. Non−Hispanic AI/AN, Non-Hispanic American Indian/Alaska Native; Non−Hispanic Asian/PI, Non-Hispanic Asian or Pacific Islander.
Figure 3
Figure 3
Incidence and 10-years limited prevalence of gliomas by tumor histology, grade and primary site. (A) Incidence of gliomas by tumor histology. (B) Incidence of gliomas by tumor grade. (C) Incidence of gliomas by primary tumor site. (D) 10-years limited prevalence of gliomas by tumor histology. (E) 10-years limited prevalence of gliomas by tumor grade. (F) 10-years limited prevalence of gliomas by primary tumor site.
Figure 4
Figure 4
Incidence of gliomas by tumor histology, sex and age at diagnosis.
Figure 5
Figure 5
Comparison of 1-/3-/5-year relative survival for glioma by histology group. Age-specific 1-/3-/5-year relative survival for (A) all cases, (B) anaplastic astrocytoma, (C) glioblastoma, (D) diffuse astrocytoma, (E) oligodendroglioma, and (F) other gliomas.
Figure 6
Figure 6
Multivariable regression analysis for gliomas. HR, Hazard ratio; CI, Confidence interval; Non−Hispanic AI/AN, Non-Hispanic American Indian/Alaska Native; Non−Hispanic Asian/PI, Non-Hispanic Asian or Pacific Islander; Sep/Div/Wid, Separated/Divorced/Widowed.
Figure 7
Figure 7
Nomogram to predict the 1-/3-/5-year survival probabilities of patients with gliomas. (A) Points of age, histology, grade, primary site and therapy (chemotherapy, radiation and surgery) are obtained by drawing a line upward from the corresponding values to the “Points” line. The sum of the points of these 7 factors is located on the “Total points” line, and a line projected down to the bottom scales determines the probabilities of 1-/3-/5-year survival probabilities. (B) Calibration plots of the nomogram for 1-/3-/5-year survival probabilities in the training set, and (C) the validation set. The gray line represents the ideal nomogram. The predicted probability of OS by the nomogram is projected onto the x-axis, and the actual OS is projected onto the y-axis. Error bars indicate 95% CIs. (D) AUC of nomogram for predict 1-/3-/5-year survival in training group, and (E) validation group. OS, Overall survival; AUC, the area under the receiver operating characteristic curve.

Similar articles

References

    1. Ostrom QT, Patil N, Cioffi G, Waite K, Kruchko C, Barnholtz-Sloan JS. CBTRUS statistical report: primary brain and other central nervous system tumors diagnosed in the United States in 2013-2017. Neuro Oncol. (2020) 22:iv1–96. doi: 10.1093/neuonc/noaa200, PMID: - DOI - PMC - PubMed
    1. Miller KD, Ostrom QT, Kruchko C, Patil N, Tihan T, Cioffi G, et al. Brain and other central nervous system tumor statistics, 2021. CA Cancer J Clin. (2021) 71:381–406. doi: 10.3322/caac.21693, PMID: - DOI - PubMed
    1. Louis DN, Perry A, Wesseling P, Brat DJ, Cree IA, Figarella-Branger D, et al. The 2021 WHO classification of tumors of the central nervous system: a summary. Neuro Oncol. (2021) 23:1231–51. doi: 10.1093/neuonc/noab106, PMID: - DOI - PMC - PubMed
    1. Cao J, Yan W, Zhan Z, Hong X, Yan H. Epidemiology and risk stratification of low-grade gliomas in the United States, 2004-2019: A competing-risk regression model for survival analysis. Front Oncol. (2023) 13:1079597. doi: 10.3389/fonc.2023.1079597, PMID: - DOI - PMC - PubMed
    1. Luo Y, Hao L, Liu C, Xiang Y, Han X, Bo Y, et al. Prognostic model for predicting overall survival in patients with glioblastoma: an analysis based on the SEER database. J Investig Med. (2023) 71:439–47. doi: 10.1177/10815589221147153, PMID: - DOI - PubMed

MeSH terms

LinkOut - more resources